
Figures & data
Figure 1. The flow diagram of the study adopted by the PRISMA Group (Moher et al., Citation2009).
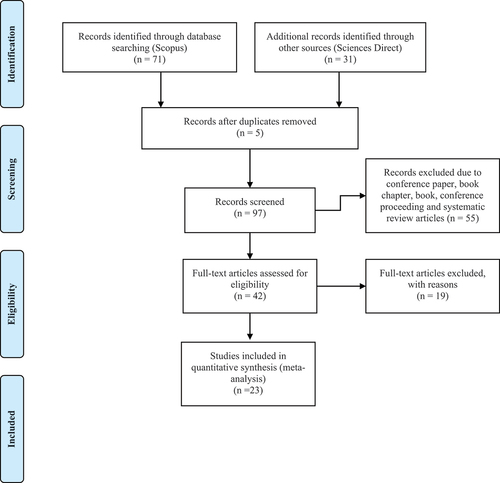
Table 1. The inclusion and exclusion criteria
Table 2. List of journals examined
Table 3. Sample selection criteria
Table 4. Top 20 daily performance measures for Islamic equity unit trust funds: July 2019—July 2020
Table 5. Top 20 daily performance measures for islamic fixed income unit trust funds: July 2019—July 2020
Figure 2. Distribution of risk adjusted returns.
