Figures & data
Figure 1. Total stock trading accounts in Vietnam over the period from 2015 to 2021.
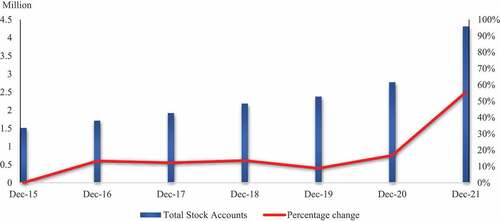
Figure 2. (a) The Vietnamese stock market index and 24 Vietnamese sectors indices volatility from 2012 to 2021. (b.) The Vietnamese stock market and 24 Vietnamese sectors indices volatility during the Covid-19 period of 2020–2021.
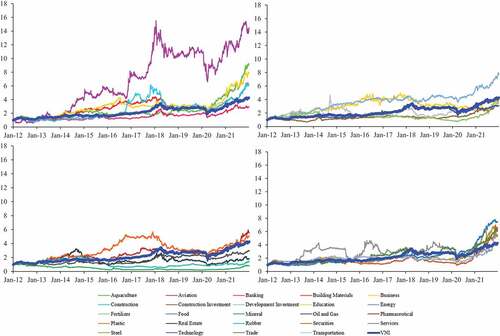
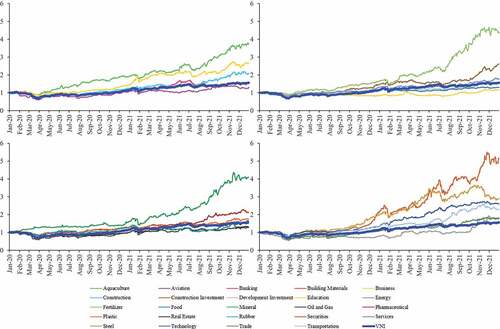
Table 1. The market volatility of 24 Vietnamese sectors using ARMA-GARCH estimations, an entire period 2012–2021
Table 2. The market volatility of 24 Vietnamese sectors using ARMA-GARCH estimations, the COVID-19 pandemic 2020–2021
Table 3. The market volatility spillovers 24 sectors in Vietnam
Figure 3. Market volatility across 24 sectors in Vietnam, the entire period 2012–2021.
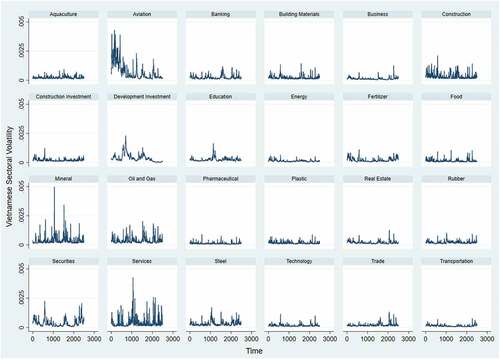
Figure 4. The total spillover effect of all sectors over the 2012–2021 period.
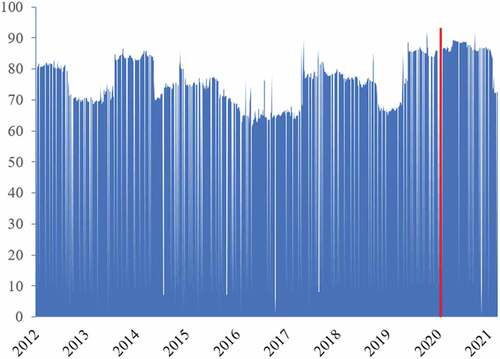
Figure 5. Spillover effects of 24 sectors in Vietnam over the 2012–2021 period.
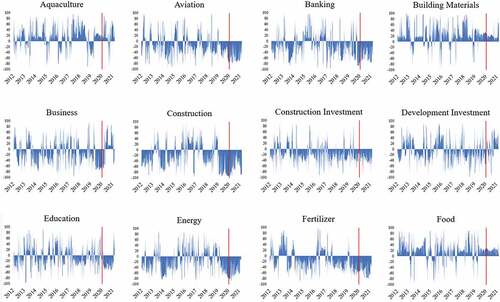

Figure 6. The comparison of the Vietnamese sectoral volatility spillover between the pre-and during the Covid-19 pandemic
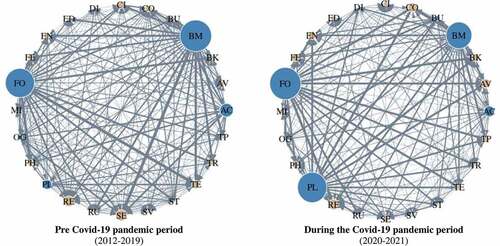
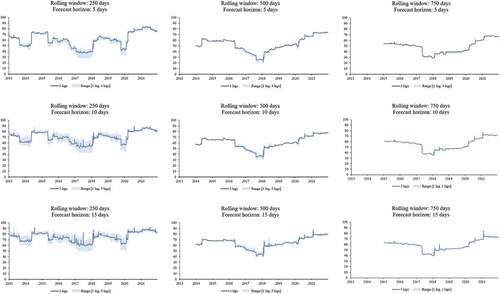
Figure 7. Robustness test of the total volatility spillover of the Vietnamese stock market.