
Figures & data
Table 1. Definition of variables, measurement and summary statistics
Figure 1. Regional distribution of savings among the youth of Ghana.
Source: Analysis of MASO data, 2020
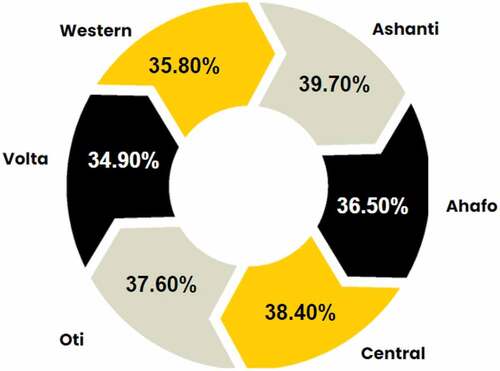
Figure 2. Distribution of economic diversification among the youth in Ghana.
Source: Analysis of MASO data, 2020.
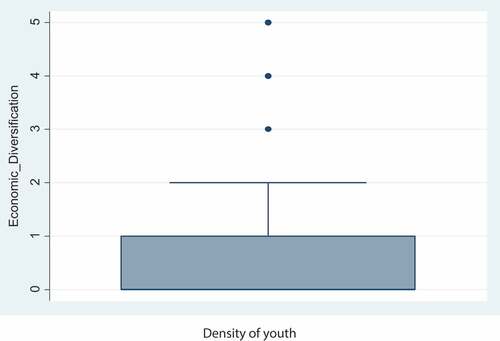
Figure 3. Density plot of Economic Diversification.
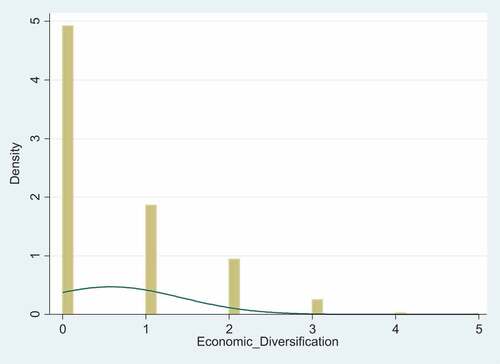
Figure 4. Reason why the youth do not save regularly in Ghana.
Source: Analysis of MASO data, 2020.

Table 2. Effect of savings on economic diversification of the youth in Ghana