
Figures & data
Figure 1. Corruption perception index.
Source: countryeconomy.com The Corruption Perception Index scale is from zero (very corrupt) to 100 (Low or no corruption).
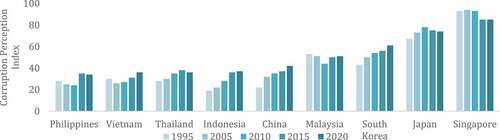
Figure 2. FDI inflows in China and ASEAN 1995-2019 US$ Billion).
Source: World Bank
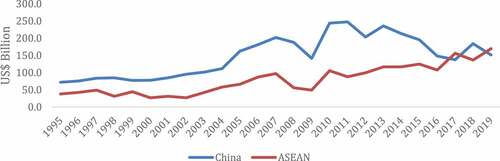
Figure 3. Total CO2 emission (Mtoe).
Source: countryeconomycom.Vertical Axe. Total CO2 Emission (Mtoe)
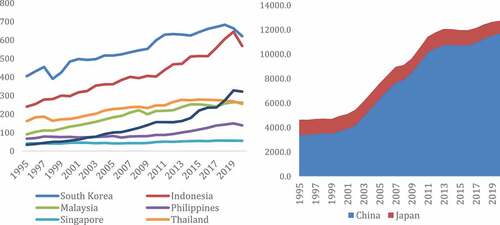
Figure 4. Conceptual framework.
Table 1. Selected variables
Table 2. Panel unit root tests results
Table 3. Panel co-integration results
Table 4. Long-run and short-run estimation results
Table 5. Short-run country-specific results