
Figures & data
Figure 1. Map of the study area Source: Arc GIS.
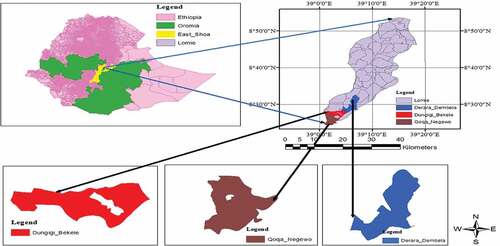
Table 1. Respondent household sampled from each selected Kebele
Figure 2. Sex and Marital status of sample households.

Table 2. Demographic characteristics of sampled respondents
Figure 3. Livestock holding by sampled households (multiple responses).
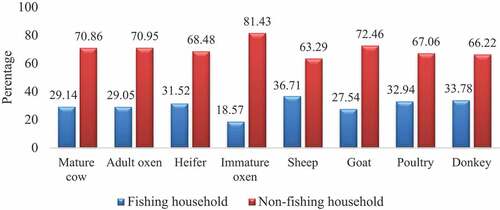
Table 3. Summary of descriptive statistics for categorical variables
Table 4. Households income sources (multiple responses)
Table 5. Mean annual income generated by different income sources (multiple responses)
Table 6. Distribution of estimated propensity score
Table 7. Performance of matching estimators
Figure 4. Distribution of propensity scores of households.
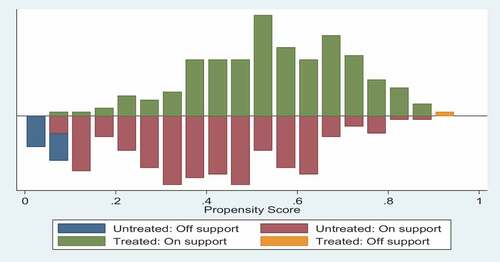
Table 8. Propensity score matching: quality test
Table 9. Average Treatment Effect on the Treated (ATT)
Table 10. Result of sensitivity analysis using Rosenbaum bounding approach Rbounds delta, gamma (1(0.25)4)