
Figures & data
Table 1. Aggregate factors and their determinants
Table 2. Variables and expected sign
Table 3. Descriptive statistics
Table 4. Correlation matrix
Figure 1. Average wage share, all Africa (%) Source: authors.
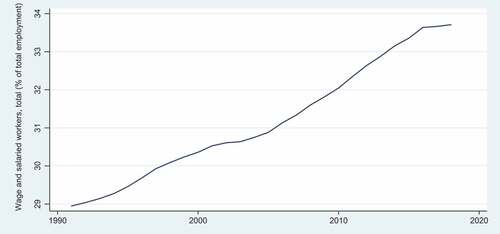
Figure 2. Wage share in Africa: trends and disparities (%) Source: authors.
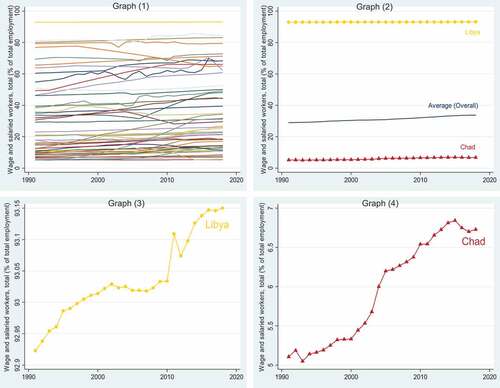
Table 5. Pooled OLS model
Table 6. Within-group FE model
Table 7. Variables definition
Table 8. GMM-SYS, overall (YF = YEU)
Table 9. GMM-SYS, overall (YF = YCHN)
Table 10. GMM-SYS, overall (YF = YUS)
Table 11. GMM-SYS, Sub-Saharan Africa (YF = YEU)
Table 12. GMM-SYS, Sub-Saharan Africa (YF = YCHN)
Table 13. GMM-SYS, Sub-Saharan Africa (YF = YUS)
Table 14. GMM-SYS, pre/post-2008 crisis periods
Table 15. Long-run coefficients
Figure 3. Changes in income distribution and State policy tools for regimes viability.
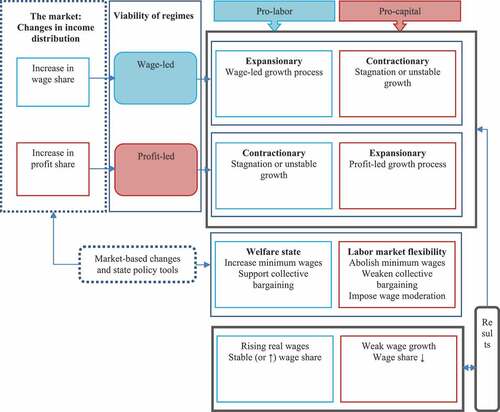
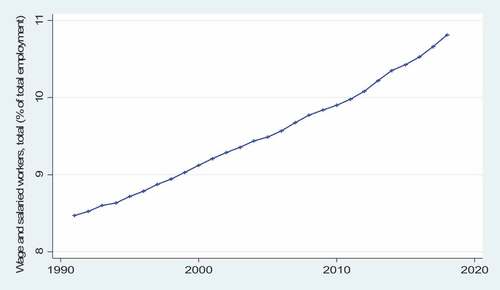
Figure 4. Trend in wage share, Benin (%) Source: authors.
Table
Table
Table
Table
Table
Table
Table