
Figures & data
Figure 1. The average annual trend of ICT penetration is SSA (2000–2016).
Source: Authors’ calculations.
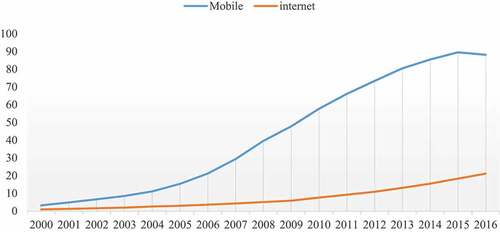
Figure 2. Average annual trend of CO2 emissions in SSA (2000–20016).
Source: Authors’ calculations.
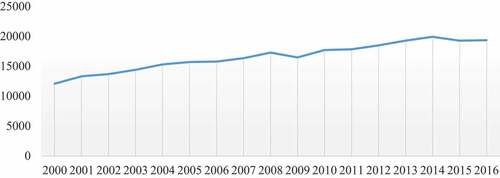
Table 1. Summary statistics
Table 2. Matrix of correlation
Table 3. Variance inflation factor (VIF) test for multicolinearity
Table 4. FGLS regression of ICT on CO2
Table 5. PCSE regression of ICT on CO2
Table 6. Sensitivity of non-interactive regression for low income countries
Table 7. Sensitivity of non-interactive regression for lower middle-income countries
Table 8. Sensitivity of non-interactive regression for upper middle-income countries