
Figures & data
Table 1. Definition, measurement, and expected signs of variables
Table 2. Definition, measurement, data source, and expected signs of structural transformation variables
Table 3. Engenvalues of structural transformation
Table 4. Common factors and weight analysis
Table 5. Structural transformation status of the countries
Figure 1. Resources shift among different sectors in both NICs and LDCs.
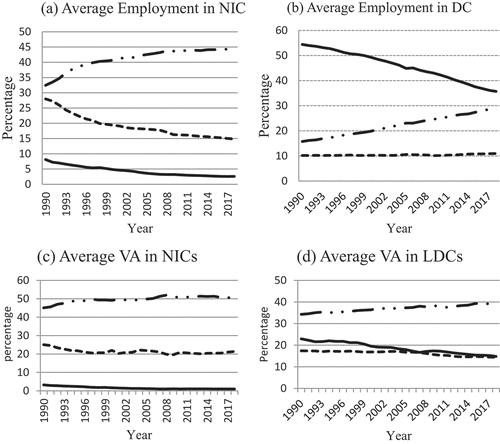
Figure 2. The trend of per capita capital stock (1990–2018).
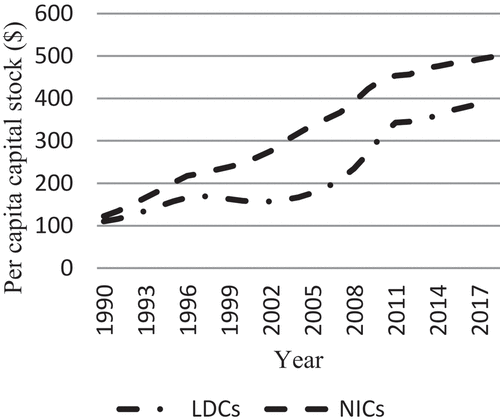
Figure 3. The trend of per capita income (1990–2018).
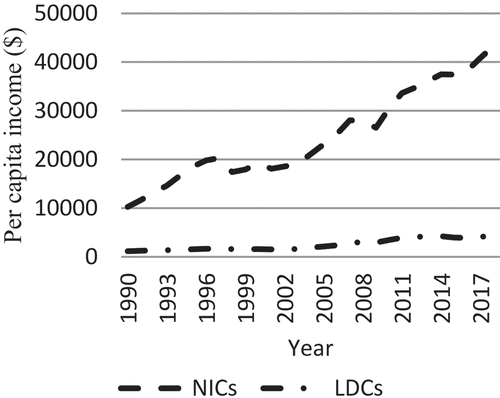
Table 6. Descriptive statistics
Figure 4. Trends of structural transformation (1990–2018).
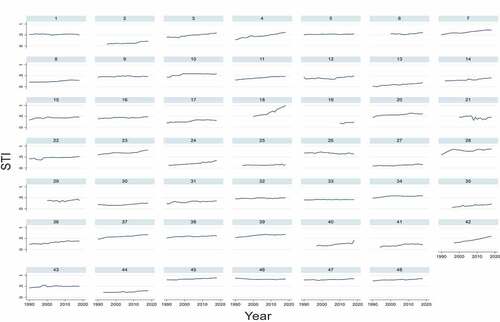
Table 7. Fisher unit root test
Table 8. The one-step arallano-bond (1991) estimation output (Developing Countries)
Table 9. Fixed effect model estimation output (Developing Countries)