
Figures & data
Figure 1. Map of the study area (Arsi and west Arsi zones).
Source: Oromia Finance and Economic Development Bureau (OFEDB; Citation2019).
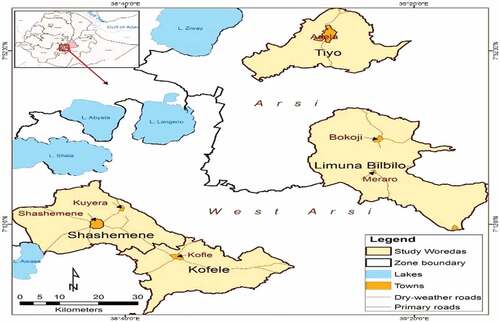
Table 1. Effects of contract farming participation on farm household livelihoods
Table 2. Selected study districts, Kebeles and sample household sizes (hhs)
Table 3. Description of variables and hypothesized influence on malt barley volume of sales
Table 4. Descriptive statistics of continuous variables (n = 384)
Table 5. Descriptive statistics of categorical variables (n = 384)
Table 6. Average malt barley produced, consumed or stored and sold (384)
Table 7. Distribution of respondents by level commercialization (384)
Table 8. Parameter estimates of Tobit model for commercialization index