Figures & data
Figure 1. Vietnam Credit Growth, GDP rate and Credit growth/GDP ratio, 2015–2019.
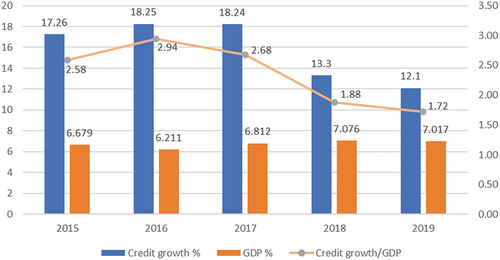
Table 1. Inputs and Outputs for DEA model
Table 2. Variables for regression model
Figure 2. CSR versus VRS efficient frontier (Source: Huguenin, Citation2012).
Table 3. Descriptive Statistics of Operating Approach data (Unit: Billion VND)
Table 4. Descriptive Statistics of Intermediation Approach data (Unit: Billion VND)
Table 5. Descriptive statistics of Average CAMELS variables during 2011–2019
Figure 3. Trend of CAMELS variables during examined period.
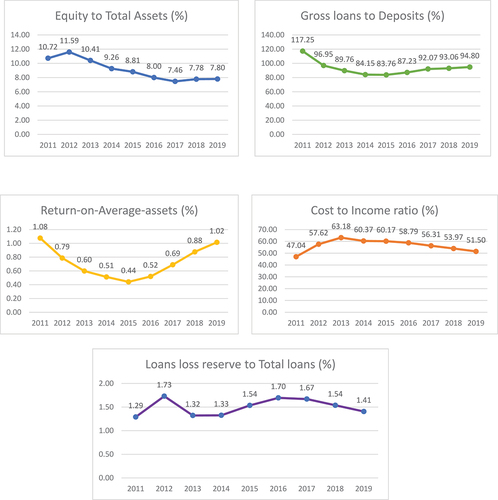
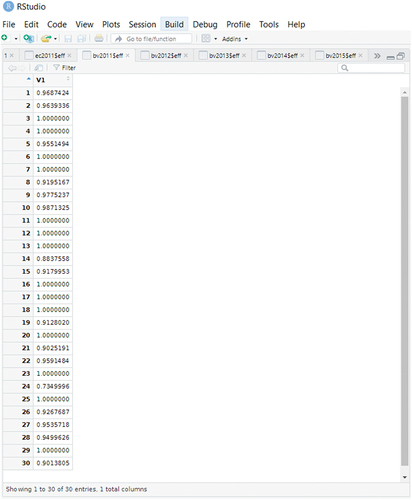
Figure 4. Bootstrap DEA scores of operating approach and intermediation approach.
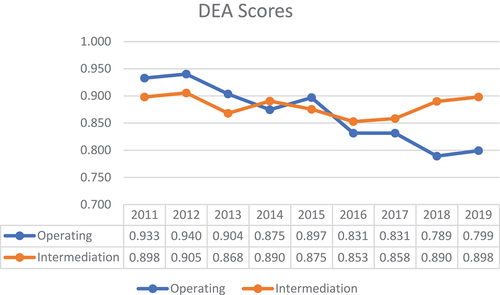
Table 6. Pearson’s Correlation of Intermediation Approach
Table 7. Pearson’s Correlation of Operating Approach
Table 8. Variance-inflation-factor (VIF)
Table 9. Truncated regression results from Intermediation approach
Table 10. Truncated regression results from Operating approach