
Figures & data
Table 1. Variable description and source of data
Table 2. Descriptive statistics of variables in the model
Table 3. ADF unit root test results
Table 4. Testing optimal lag selection of PVAR model for Asia
Table 5. Testing optimal lag selection of PVAR model for Europe
Figure 1. Inverse roots of AR characteristic polynomial.
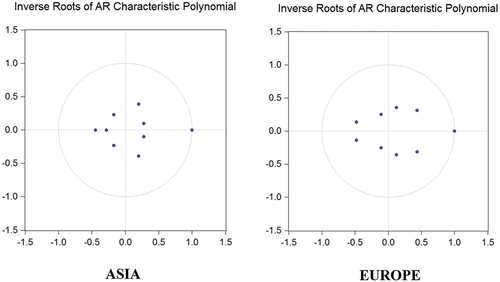
Table 6. Results of Granger causality test
Figure 2. Impulse-response function in Asia.
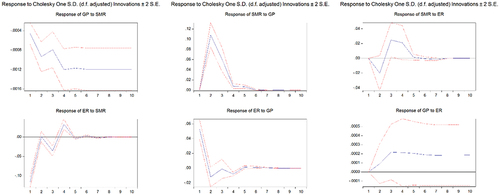
Figure 3. Impulse-response function in Europe.
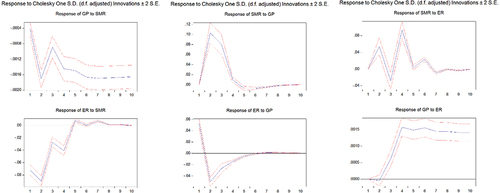
Table 7. Variance decomposition analysis
Figure 4. Ordering of Asian countries’ PVAR: GP, SMR, ER.
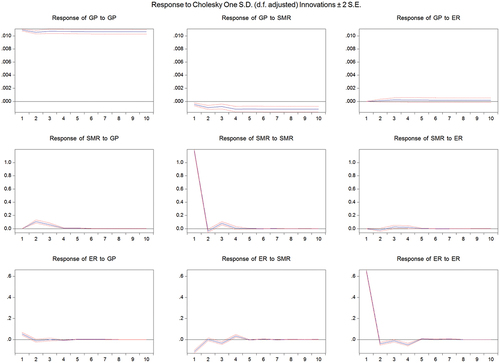
Figure 5. Ordering of Asian countries’ PVAR: ER, GP, SMR.
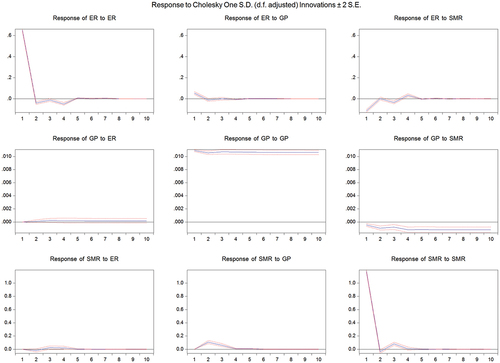
Figure 6. Ordering of European countries’ PVAR: GP, SMR, ER.
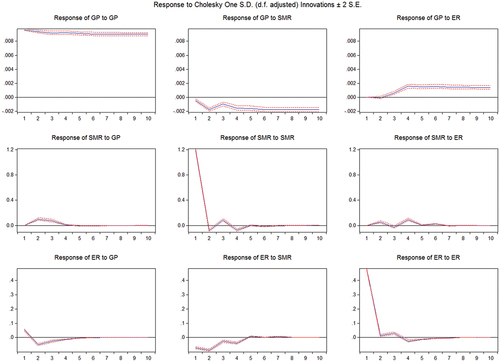
Figure 7. Ordering of European countries’ PVAR: ER, GP, SMR.
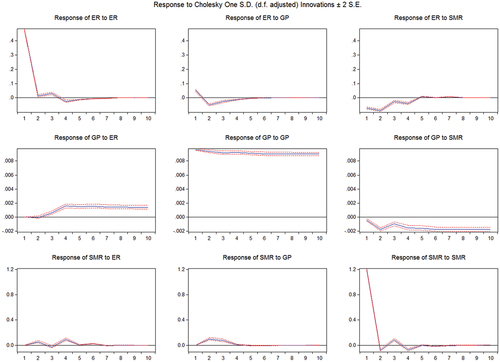
Table A1. Review of selected studies on the relationship between stock market, gold price and exchange rate