
Figures & data
Figure 1. GCG Development of commercial banks for the period 2014–2019.
Source: Processed data, 2014–2019 GCG Report
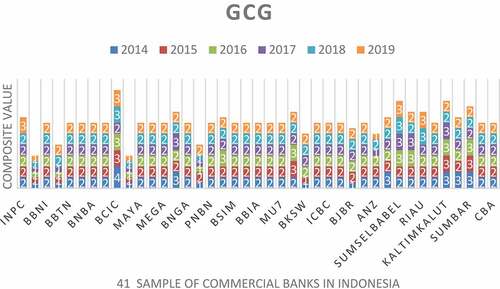
Table 1. Financial Ratios of commercial banks 2014–2019
Table 2. Composite rating of bank health using the RBBR Method
Figure 2. Research framework.
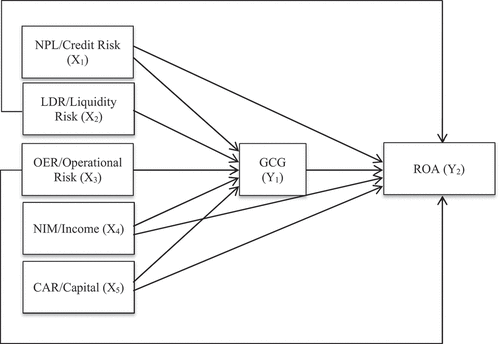
Table 3. Research sample
Table 4. Outer model, composite reliability and average variance extracted (AVE)
Table 5. Cross-Loading and R-square
Table 6. Path coefficients
Table 7. Statistical results of indirect effect
Table 8. VAF results of mediating effect
Table 9. Effect size (f 2)