
Figures & data
Table 1. Unit root tests
Table 2. Descriptive statistics
Figure 1. VAR Granger Causality Test. Source: Author’s own.
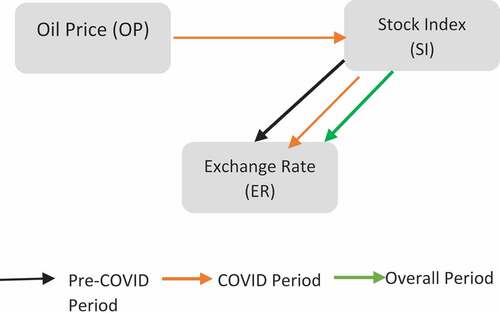
Table 3. Wald Joint Sig. Test
Table 4. Unrestricted VAR
Table 5. Unrestricted VAR
Figure 2. Impulse-Response-Function pre-COVID period. Source: Author’s own.
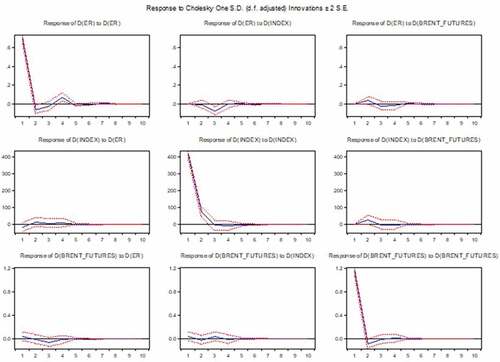
Figure 3. Impulse-Response-Function during COVID period. Source: Author’s own.
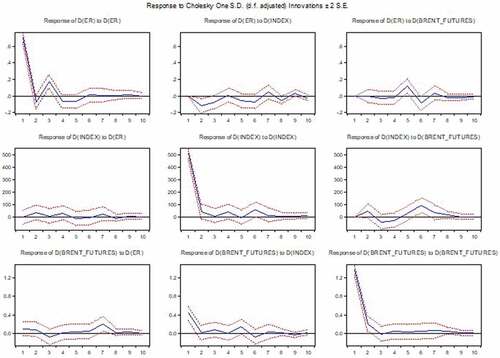
Figure 4. Impulse-Response-Function in overall period. Source: Author’s own.
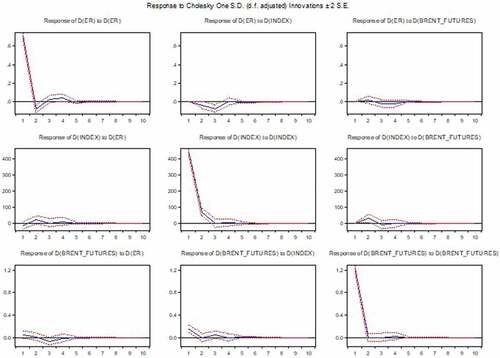
Table 6. Variance Decompositions (VDCs)—pre-COVID period
Table 7. Variance Decompositions (VDCs)—during COVID period