Figures & data
Table 1. Studies that find positive/negative /no relation with alternative indicators on corruption-economic growth models
Table 2. Categorisation of the processes of corruption measurement
Table 3. Variables, symbols, period, price scale, sources, and literature
Table 4. Minimum, maximum, averages, and standard deviations of the variables
Table 5. Long-term effects of augmented Solow and endogenous models with fixed effect AR (1) dynamic estimation method
Table 6. Long-term effects of augmented Solow and endogenous models with FMOLS estimation method
Table 7. Effects of corruption on economic growth with AR (1) and FMOLS (dynamic) estimation method, using CPI Corruption indicator in five regions according to the world bank’s classification
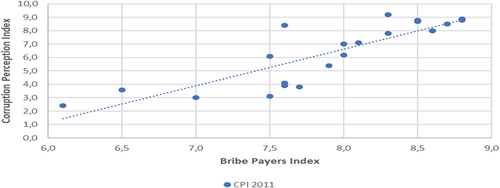
Figure 1. Dispersion chart between countries for Corruption Perceptions Index–Bribe Payers Index for 2011. Source: Transparency International (www.transparency.org).