
Figures & data
Figure 1. The research framework.
Source: Author’s own, Note: SPO: Small Savings Scheme; FLB: Financial Literacy and Behavior; FC: Financial Consultant
Table 1. Support for scale items and theoretical background
Table 2. Factor loadings
Figure 2. Measurement model.
Source: Authors’ own
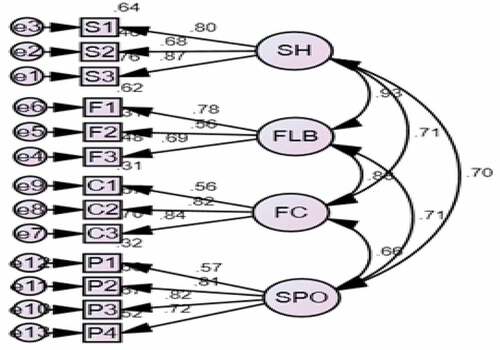
Table 3. Measurement model fit indices
Table 4. Test of convergent validity of measurement model
Table 5. Discriminant validity test of measurement model
Figure 3. Structural model.
Source: Authors’ own
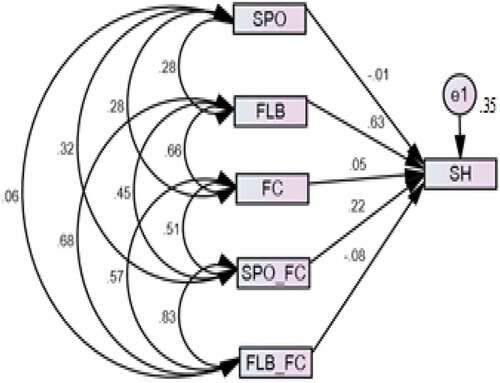
Table 6. Structural Model Fit Indices
Table 7. Path details of the structural model
Table A1. Total Variance Explained
Table A2. KMO and Bartlett’s Test