998
Views
1
CrossRef citations to date
0
Altmetric
FINANCIAL ECONOMICS

Correlations and volatility spillover from China to Asian and Latin American Countries: Identifying diversification and hedging opportunities

ORCID Icon, , &
Article: 2132634 | Received 18 Apr 2022, Accepted 02 Oct 2022, Published online: 22 Oct 2022

Figures & data

Figure 1. Time series plots of China, India, Brazil, Mexico and Indonesia.

Figure 1. Time series plots of China, India, Brazil, Mexico and Indonesia.

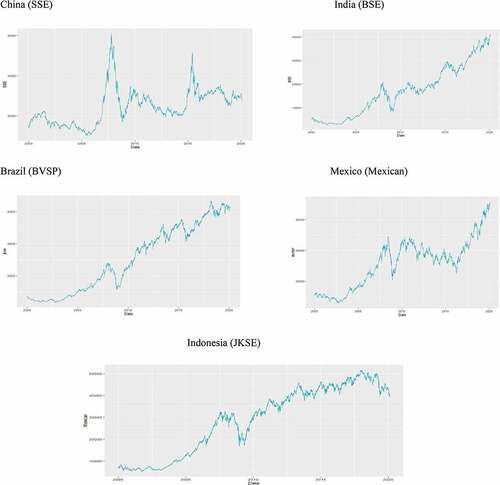
Table 1. Summary statistics for daily returns

Figure 2. Plots of daily returns.

Figure 2. Plots of daily returns.

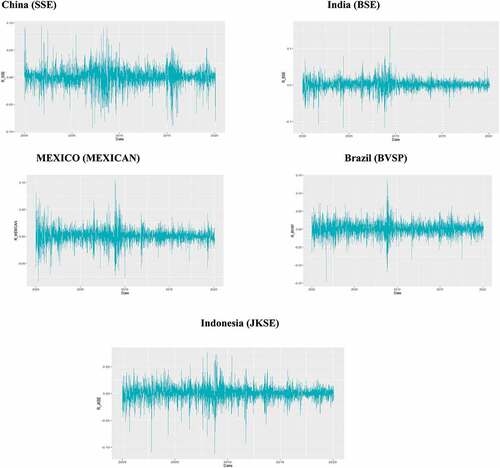
Table 2. Correlation between daily returns

Table 3. VARMA (1,1)- MGARCH(1,1) parameter estimates

Table 4. Hedge ratio (long/short) summary statistics

Table 5. Portfolio weights summary statistics