Figures & data
Figure 1. Numerical examples of the mechanical effect hypothesis
Notes: This figure portrays the example in Table . As exhibited, Tobin’s q converges to 1 by increasing the debt leverage. When q > 1, it converges from above, and when q < 1, it converges from bellow.
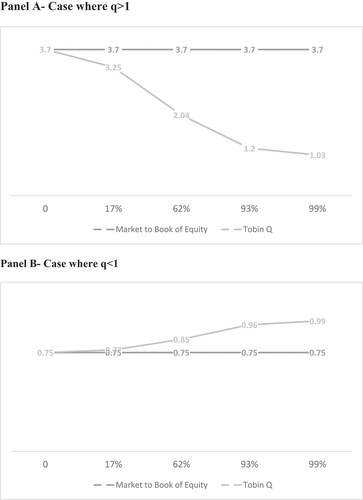
Table 1. Numerical examples of the mechanical effect hypothesis*
Table 2. 8 country sample obtained at the Refinitiv Eikon-Datastream Database
Table 3. Computing the variables at Refinitiv Eikon-Datastream Database
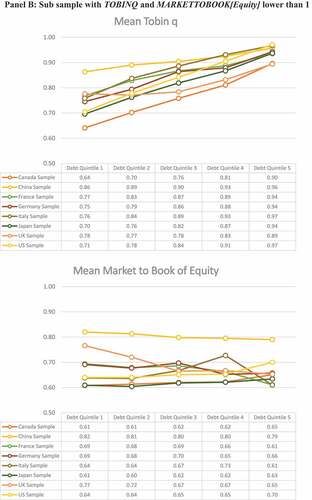
Figure 2. Empirically comparing the mechanical effect hypothesis and the informational content of prices hypothesis Panel A: Sub sample with TOBINQ and MARKETTOBOOK[Equity] higher than 1
![Figure 2. Empirically comparing the mechanical effect hypothesis and the informational content of prices hypothesis Panel A: Sub sample with TOBINQ and MARKETTOBOOK[Equity] higher than 1](/cms/asset/e2074570-f3a1-4e70-bfff-a2e79e297589/oaef_a_2132636_f0002a_oc.jpg)
Figure 2. Continued.