
Figures & data
Figure 1. Spatial locations of surveyed villages in three randomly selected subdistricts (tehsils) of Punjab. Source: Own data made by using QGIS software.
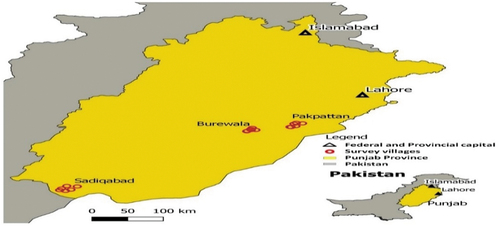
Table 1. Adoption and food security status of sampled households
Table 2. Descriptive statistics of variables
Table 3. Estimates of the endogenous switching probit model
Table 4. Treatment effects of CMBs adoption on the food security status
Table A1. Rotated component loading from PCA
Table A2. Correlation of selection instruments with adoption and food security status
Table A3. The relevance and exogeneity conditions for selection instruments
Table A4. Falsification approach to validate selection instrument
Table A5. Regression estimates of adoption of CMBs from a probit model (main model)
Table A6. Treatment effects of CMBs adoption on food security status (reduced model excluding all potentially endogenous variables)
Table A7. Estimates of the endogenous switching probit model (reduced model excluding all potentially endogenous variables)
Table A8. Treatment effects of exclusive CMBs adoption versus exclusive SCPs adoption on food security status (N = 222)