
Figures & data
Table 1. Variables, Description and Sources
Figure 1. Various Indexes of Financial Inclusion and GDP per capita.
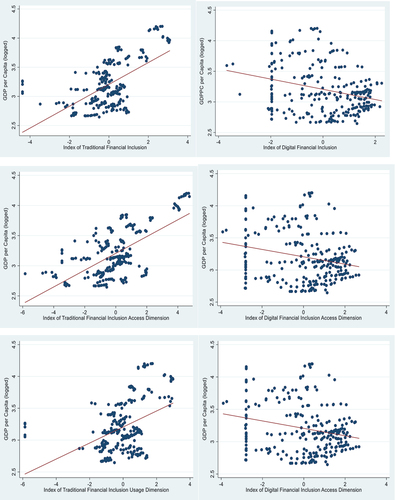
Table 2. Descriptive Statistics of Variables
Table 3. Baseline Result
Table 4. The Access sub dimension (Traditional and Digital) and GDP per capita
Table 5. The Usage sub dimension (Traditional and Digital) and GDP per capita
Table 6. GMM Estimate of the Impact of Traditional and Digital Financial Inclusion on Economic Growth for Middle- and Low-Income Countries
Table 7. Panel VAR Granger causality test
Table 8. Robustness Analysis of the Impact of Traditional and Digital Financial Inclusion on Economic Growth using PCSE (Full Sample)
Table 9. Robustness Analysis of the Impact of Traditional and Digital Financial Inclusion on Economic Growth using PCSE (Sub-Sample)