
Figures & data
Figure 1. Population breakdown in South Asia
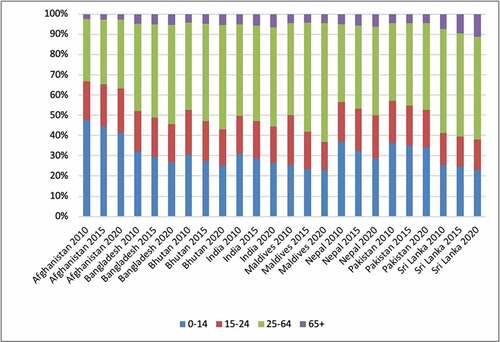
Figure 2. Youth in NEET in South Asia
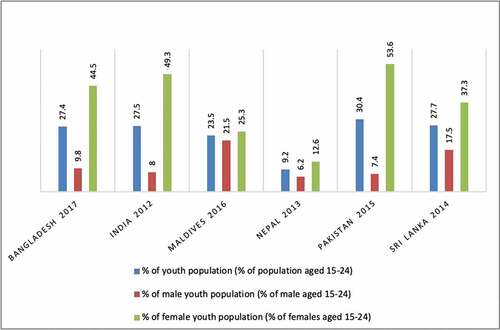
Figure 3. Youth unemployment in South Asia by 2018
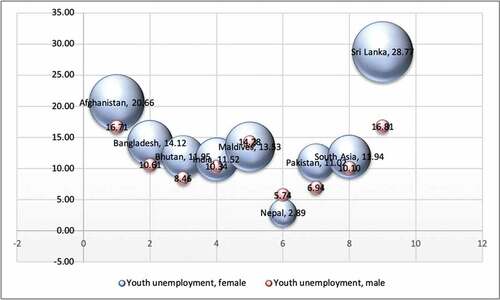
Figure 4. Account ownership by South Asian youth by countries
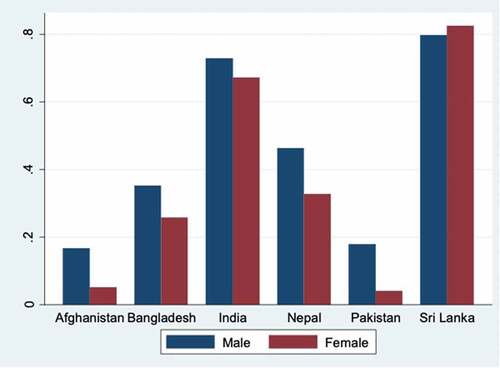
Figure 5. Account ownership by South Asian youth by income level and education level
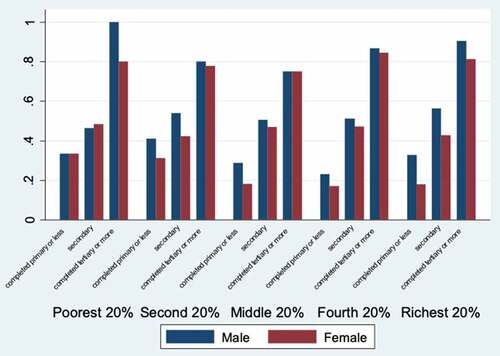
Figure 6. Account ownership by South Asian youth by income level and employment status
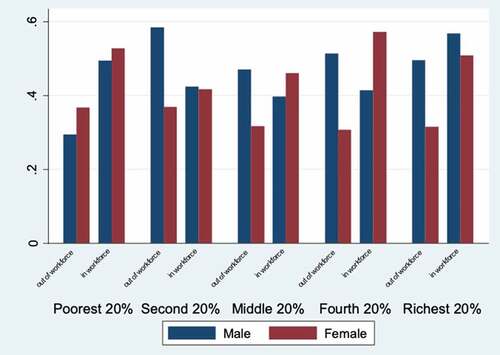
Figure 7. Mobile phone, ID, and account ownership by South Asian youth
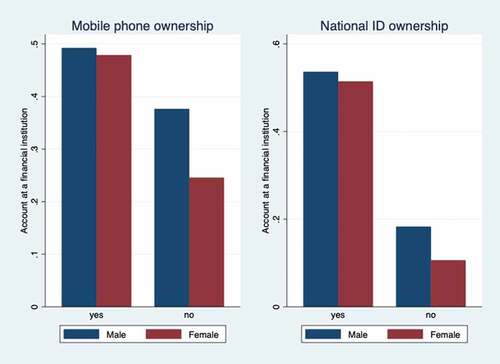
Figure 8. Why financially excluded?
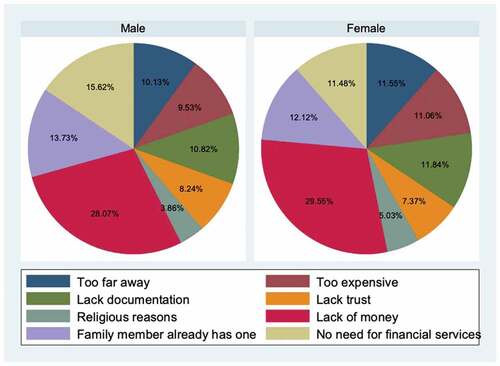
Table 1. Questions used to construct the financial inclusion index
Figure 9. Distribution of Financial Inclusion Scores
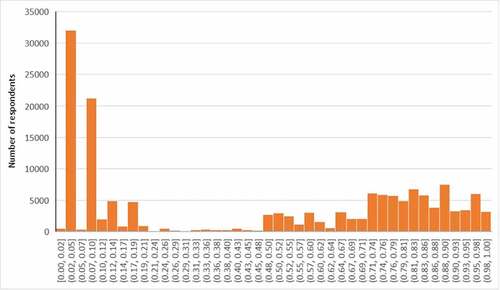
Table 2. Drivers of youth’s financial inclusion in South Asia
Figure 10. Predictive margins by gender with 95% CIs
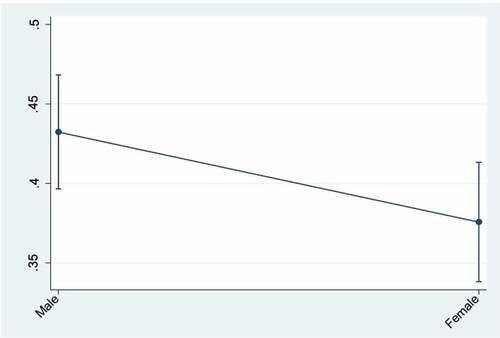
Figure 11. Predictive Margins of Female*Received wage or self-employment payments with 95% CIs
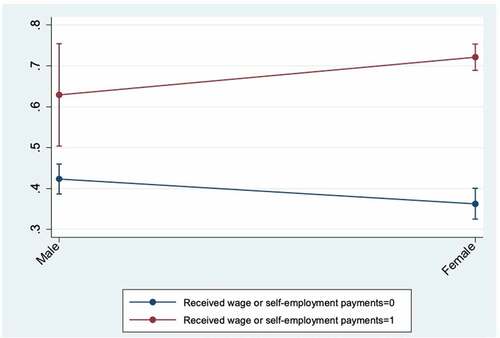
Table 3. Drivers of youth’s financial inclusion in South Asia by gender
Table A1. Ranking of financial inclusion country averages—the whole sample
Table A2. Ranking of financial inclusion country averages—South Asian sample
Table A3. List of variables
Table A4. Descriptive statistics
Table A5. Correlation matrix
Table A6. Robustness checks with interactive dummies
Table A7. Drivers of youth’s financial inclusion in South Asia
Table A8. Drivers of financial inclusion in South Asia
Table A9. Predictive margins
Table A10. Predictive margins
Table A11. Testing for random slopes