
Figures & data
Table 1. Results of the linearity test
Table 2. Results of the linearity test
Figure 1. The mean private credit, which is a claim against the private sector by financial intermediaries and the estimated threshold. Note: The value of private credit is expressed as a percentage. Source: Author’s calculation based on WDI (2022) data.
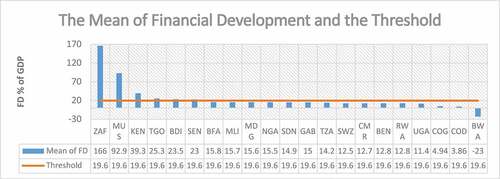
Table 3. Panel smooth transition regression model estimation
Table 4. Finance-Inequality: robustness and sensitivity checks model
Data availability statement
Publicly available datasets were analysed in this study. This data can be found here: [http://data.worldbank.org/data-catalog/world-development-indicators (accessed on 2 October 2022)]. Further inquiries can be directed to the corresponding author.