
Figures & data
Table 1. Real GDP per capita growth rates (%) in different regions of the world economy, 1820–2018
Table 2. Real GDP per capita growth rates (%) in different countries of the world economy, 1820–2018
Figure 1. Expenditure in the metropolis under the scope of the development plans, 1953–1971 (percentage of GDP).
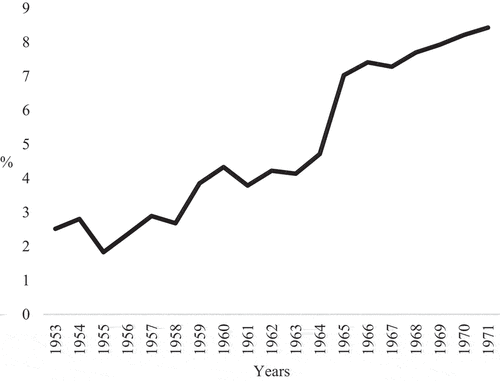
Table 3. Portuguese GDP growth rates and its components (%), 1913–2018
Figure 2. Sectoral production of the Portuguese economy, 1947–1977 (1947 = 100).
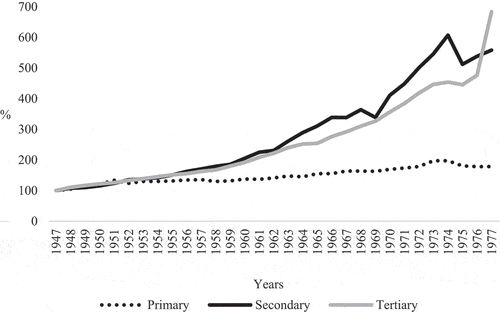
Figure 3. Degree of Openness of the Portuguese Economy (as a percentage of GDP), 1885–2018.
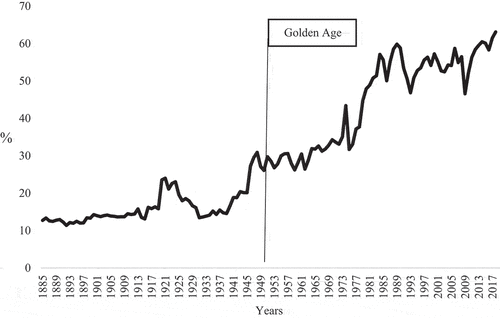
Figure 4. Portuguese GDP per capita as a percentage of the G7ʹs average GDP per capita, 1885–2018.
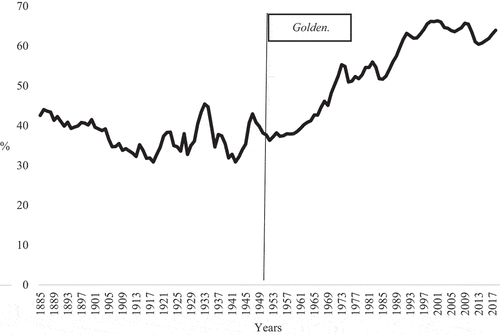
Table 4. Results of the estimations (OLS method with Robust Standard Errors)
Table
Table
Table
Table