Figures & data
Figure 1. Consumer price index and exchange rate in Vietnam from January 2009 to May 2020. Source: International Financial Statistics (IFS).

Table 1. Data sources
Table 2A. Unit root test
Table 2B. ADF breakpoint unit root test (innovational outlier and additive outlier)
Table 3. Optimal lag length
Table 4. ARDL model results. Number of observations: 135 after adjustments
Table 5. NARDL model results
Table 6. Diagnostic statistics
Table 7. The existence of the threshold model for exchange rate and money supply
Table 8. Results of the threshold model with the threshold exchange rate and money supply variables
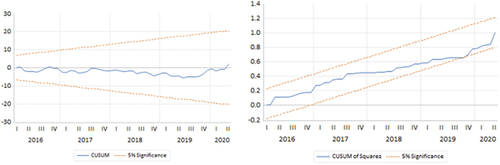
Figure A1. CUSUM and CUSUMQ in ARDL model.
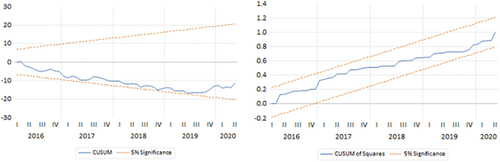
Figure A2. CUSUM and CUSUMQ in NARDL model. As the CUSUM and CUSUMQ lines were within the 5% significance level, the outputs signified that the parameters were stable.