
Figures & data
Table 1. Descriptive statistics in developing vs. developed countries
Table 2. Correlation matrix for developing countries
Figure 1. Tax structures and ratio by income level; (a) developed; (b) developing; (c) developed and developing countries.
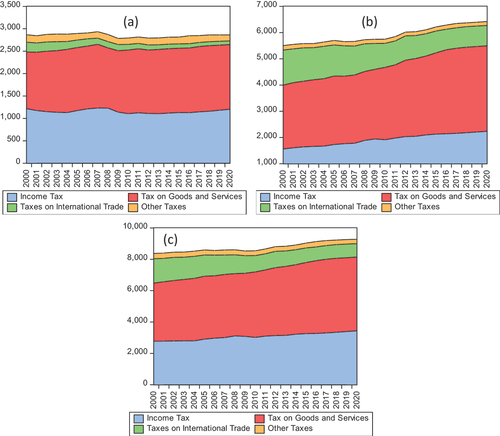
Figure 2. Plots of the average tax as a percentage of GDP against average GDP per capita over 2000–2020, (a) developed; (b) developing; (c) developed and developing countries.
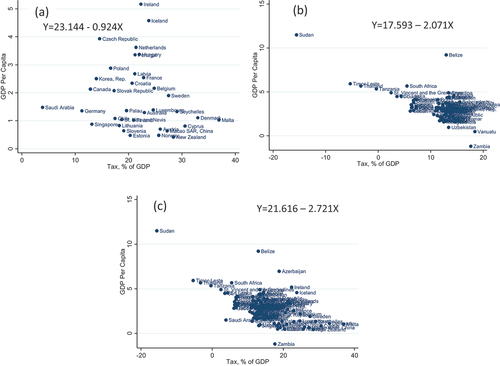
Figure 3. Plots of the average GDP per capita against (a) average share of income tax; (b) average share of tax on goods and services; (c) average share of taxes on international trade; (d) average share of other taxes for developed countries.
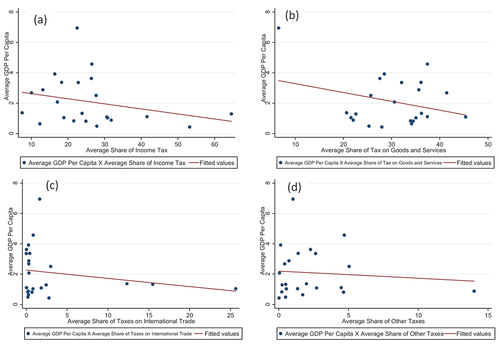
Figure 4. Plots of the average GDP per capita against (a) average share of income tax; (b) average share of tax on goods and services; (c) average share of taxes on international trade; (d) average share of other taxes, developing country.
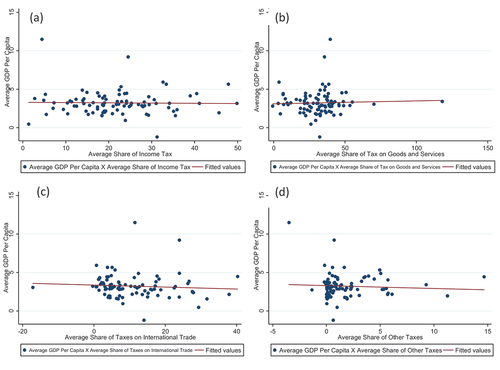
Table 3. Results of fixed effects (within) estimations dependent variable: GDP per capita growth (N = 90 developing and 47 developed countries; T = 21; sample period = 2000–2020)
Table 4. Results of fixed effects (within) estimations dependent variable: FDI (net inflows) (N = 90 developing and 47 developed countries; T = 21; sample period = 2000–2020)
Table 5. Results of fixed effects (within) estimations dependent variable: Unemployment (N = 90 developing and 47 developed countries; T = 21; sample period = 2000–2020)
Table A1. Developing countries
Table A2. Developed countries