
Figures & data
Figure 1. Assets of a bank sensitised by those of the borrower.
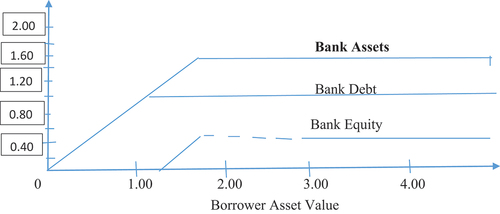
Table 1. The architecture of fuzzy systems by Ross et al. (2010)
Table 2. The process of fuzzification and de-fuzzification of model variables
Table 3. The three stages of the study procedure or variables
Table 4. Distribution of banks by their annual structural (S) and Fuzzy KMV (F) DP values and hazard ratios (H) for the period 2008–2020
Table A1. Distribution of banks by their transaction costs (Costs of Ordinary Equity, for 2008–2020 (%)
Table A2. Banks’ traditional and fuzzy asset standard deviations for 2008–2020 (%)
Table A3. Distribution of banks by their traditional and fuzzy ROEs for 2008–2020 (%)
Table A4. Distribution of banks by their traditional and equity—sset ratios for 2008–2020 (%)