
Figures & data
Table 1. Sample size distribution between target kebelesFootnote1
Table 2. Measurement and description of variables
Table 3. Financially included and excluded respondents
Table 4. Percentage distribution of financial inclusion attributes
Table 5. Summary statics of continuous variables on the determinants of financial inclusion
Figure 1. Reasons rural households motivated to use formal financial institutions.
Sources: own survey computation (2022)
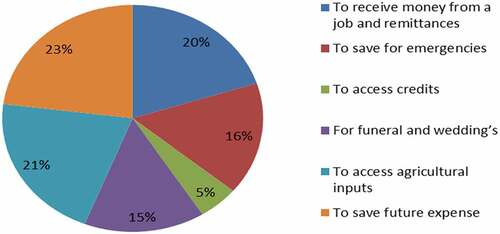
Figure 2. Source of loans in the rural area.
Sources: own survey computation (2022)
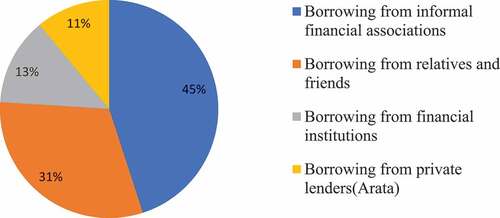
Table 6. Summary of diagnostic tests
Table 7. Binary logistic regression estimation result and respective marginal effect for financial inclusion