
Figures & data
Table 1. Summary statistics. This table reports the summary statistics of variables used in this study. The sample consists of firm-year observations between 1992 and 2018. All continuous variables are winsorized at the 1st and 99th percentile. Panel A provides summary statistics of the full sample. Panel B compares the name uncommonness of CEO names with the first names in the general population. Panel C compares the average name uncommonness of all CEO names with that of the CEOs of 100 companies with the most patents granted. Significance level of the test of the differences between the means of the two samples is denoted next to the column “Difference”
Figure 1. CEO name uncommonness by year.
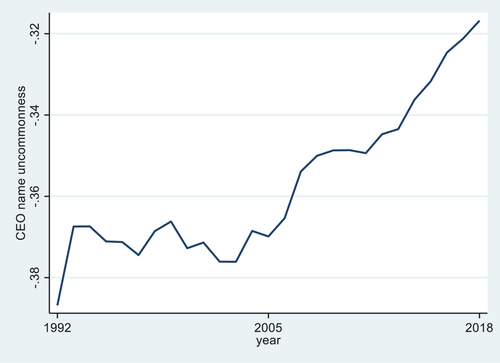
Table 2. CEO name uncommonness and corporate innovation: OLS regression. This table presents the results of multivariate regressions that estimate the effect of CEO name uncommonness on corporate innovation in a pooled OLS framework. The sample consists of firm-year observations between 1992 and 2018. I estimate the following equation: The dependent variable Ln(1+ Pat)i,t+n, is the natural logarithm of one plus the number of patents filed (and eventually granted) in one (t + 1), two (t + 2), and three (t + 3) years, and results are reported in columns (1)—(3), respectively. The dependent variable LnCitei,t+n, is the natural logarithm of one plus the average number of citations received per patent in one (t + 1), two (t + 2), and three (t + 3) years, and results are reported in columns (4)—(6), respectively. Uncommonnessi,t is an uncommonness measure of the CEO’s name constructed based on the frequency of first names in the population. Year fixed effects Yeart and firm fixed effects Firmj are included in all regressions. All other variables are as defined in Appendix A. Standard errors clustered by CEO-firm pairs are reported in parentheses. ***, **, and * indicate significance at the 1%, 5%, and 10% level, respectively
Table 3. Difference-in-differences test. This table reports the results of a differences-in-differences test on how patents produced in a firm are affected following the departure of a CEO with an uncommon name. Using a sample of all firms that experienced a sudden death of its CEO over the entire sample period of 1992–2018, I retain firm-year observations for a five-year window centered in the CEO death year and estimate the following model: where Treati is a dummy that equals one for treatment firms (departing CEO’s name uncommonness is above sample median) and zero for control firms (departing CEO’s name uncommonness is below sample median). Postt is a dummy variable that equals one for years on or after the CEO’s departure. Year fixed effects Yeart and industry fixed effects Industryi are included in all regressions. All other variables are as defined in Appendix A. Standard errors clustered by CEO-firm pair are reported in parentheses. ***, **, and * indicate significance at the 1%, 5%, and 10% level, respectively
Figure 2. Dynamics of innovation output around the death of uncommonly named CEO.
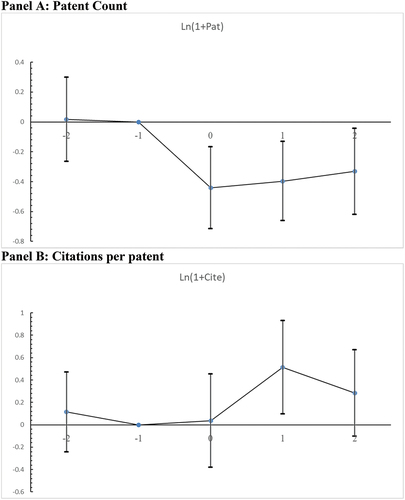
Table 4. Investment in innovation. This table shows the effect of CEO name uncommonness on corporate innovation input measures. Innovation inputs are measured by two variables. The first measure R&D/AT is R&D expenditures divided by total assets and the results are reported in columns (1)-(3). The second measure is Asset Growth, the annual asset growth rate, and the results are reported in columns (4)-(6). All other variables are as defined in Appendix A. Standard errors clustered by CEO-firm pair are reported in parentheses. ***, **, and * indicate significance at the 1%, 5%, and 10% level, respectively
Table 5. Patents in known vs unknown classes. This table shows the effect of CEO name uncommonness on the number of patents in previously known vs unknown areas. The dependent variable Ln(1+ Known) is the natural logarithm of the number of patents in technology classes that the firm has applied for and eventually granted before a given year. The dependent variable Ln(1+ Unknown) is the natural logarithm of the number of patents in technology classes that the firm has never applied for and granted before a given year. All other variables are as defined in Appendix A. Standard errors clustered by CEO-firm pair are reported in parentheses. ***, **, and * indicate significance at the 1%, 5%, and 10% level, respectively
Table 6. Patents proximity and economic value. This table shows the effect of CEO name uncommonness on the patent technological proximity between newly filed patents and those filed before as well as the patent’s economic value. The dependent variable Proximity is a continuous measure of patent technological proximity between newly filed patents and those filed before (Balsmeier et al., Citation2017; Jaffe, Citation1989). The dependent variable is the moving average of the economic value for the patents filed in a three-year window (t + 1 to t + 3) based on the patent value data compiled by (Kogan et al., Citation2017). All other variables are as defined in Appendix A. Standard errors clustered by CEO-firm pair are reported in parentheses. ***, **, and * indicate significance at the 1%, 5%, and 10% level, respectively
Table 7. Citation distributions. This table shows the effect of CEO name uncommonness on the number of patents with different scientific impacts based on the citation distributions. Specifically, I sort patents into three groups based on the citation distribution of the patents filed in the same technological class in a given year. The dependent variable Ln(1+ High Impact) is the natural logarithm of one plus the number of patents that belong to the top quartile of citation distributions, and the results are presented in Panel A. Ln(1+ Mid Impact) is the natural logarithm of one plus the number of patents that belong to the middle 50% of citation distributions, and the results are presented in Panel B. Ln(1+ Low Impact) is the natural logarithm of one plus the number of patents that belong to the bottom quartile of citation distributions, and the results are presented in Panel C. All control variables in EquationEquation (1)(1)
(1) and year fixed effects and firm fixed effects are included. All other variables are as defined in Appendix A. Standard errors clustered by CEO-firm pair are reported in parentheses. ***, **, and * indicate significance at the 1%, 5%, and 10% level, respectively
Table