
Figures & data
Table 1. Variables used in the study
Figure 1. India’s OFDI trend (2008–2018).
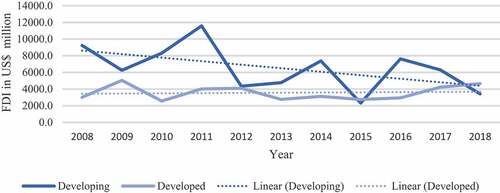
Table 2. Descriptive statistics of developing nations
Table 3. Correlation of developing nation
Table 4. PPML estimation—developed nations
Table 4a. PPML Estimation -Developed Nations: Interaction Effect
Table 5. PPML Estimation – Developing Nations
Table 5a. PPML Estimation -Developing Nations: Interaction Effect
Table 6. Robust PPML Estimation- Developed nation without USA
Table 6a. Robust PPML Estimation -Developed Nations without USA: Interaction Effect
Table 7. Robust PPML Estimation- Developing nations without Singapore & UAE
Table 7a. Robust PPML Estimation -Developing Nations without Singapore & UAE (Interaction Effect)
Table A1. List of Developed & Developing Nations