
Figures & data
Figure 1. Conceptual framework.
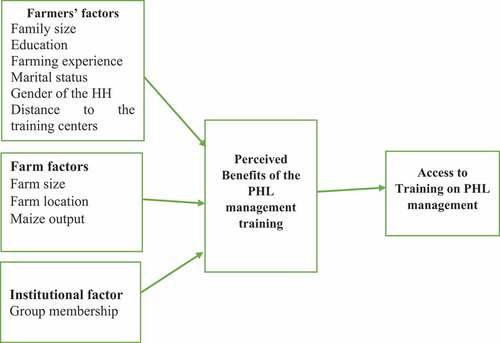
Figure 2. Geographic location of the study area.
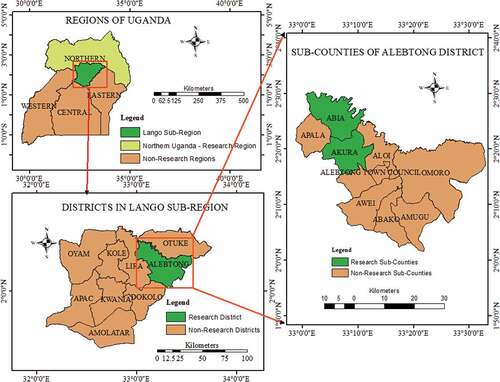
Table 1. Explained and explanatory variables
Figure 3. Frequency of farmers with access to PHL management trainings.
Sources of PHL management trainings
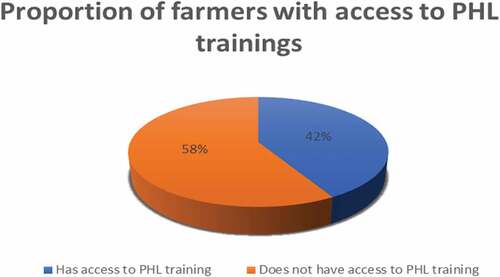
Table 2. Sources of PHL trainings
Table 3. Comparison of access to PHL trainings across farmers’ socio-demographics
Table 4. PHL management practices adopted by the farmers
Figure 4. Barriers impeding access to PHL management trainings.
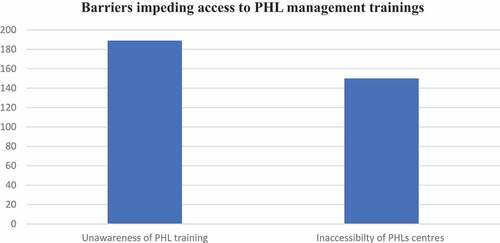
Table 5. Binary logit estimates of the determinants of access to PHL trainings