Figures & data
Figure 2. African countries (shaded red) that will be severely affected by rising temperatures due to climate change. The remainder will also, inevitably, be impacted, but not as severely.
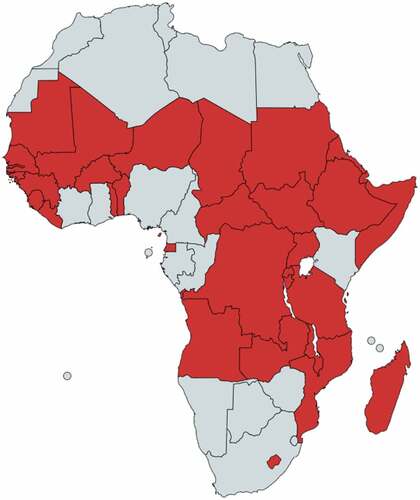
Figure 3. GDP per capita deviation from a GDP per capita baseline scenario (in which climate change does not affect macroeconomic development) resulting from continued global warming for Southern African countries until 2050. (a) scenario in which global warming is below +2°C and (b) scenario in which global warming exceeds 2°C by 2050 and exceeds +4°C by 2100. Shaded regions represent a 68% statistical confidence interval (i.e., one standard deviation).
Figure 4. Simulated share prices for a 60% share price shock occurring halfway through a ten-year simulation cycle, due to (a) a physical climate risk event in which volatilities post the even do increase by 10% and (b) a transition climate risk event in which equity volatilities do not increase after the event. Note the same vertical scale for comparison.
Figure 5. Simulated lognormal distributions (side and plan view) of share prices for a 40% share price shock occurring halfway through a ten-year simulation cycle, due to (a) a physical climate risk event and (b) a transition climate risk event.
Figure 6. Simulated share prices for 40% share price shocks occurring at two-year intervals through a ten-year simulation cycle, due to physical climate risk events.
Figure 7. Scaling factor increase in PD for ,
,
and
equity price shocks for (a) a physical climate event for credit grades AAA through BBB, (b) a physical climate event for credit grades BBB- through CCC/C, (c) a transition climate event for credit grades AAA through BBB and (d) a transition climate event for credit grades BBB- through CCC/C.
Figure 8. Time decay of a 60% climate change shock on the implied PD of an A- credit.
Figure 9. Scaling factor to be applied to unshocked obligor PDs for (a) physical and (b) transition related climate events as a function of shock size and unshocked PD. Again, note the same vertical scale for comparison.