
Figures & data
Table 1. Descriptive statistics
Figure 1: Fractional polynomial relationship between post-split price and changes in individual ownership post split
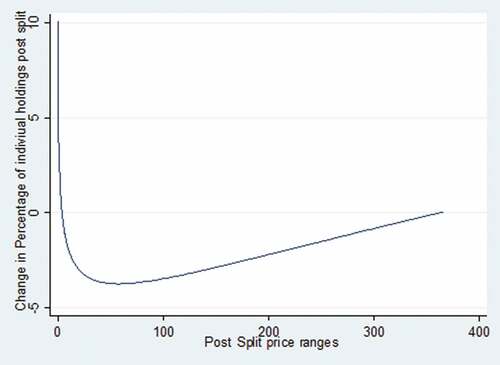
Table 2. Correlation matrix
Table 3. Univariate analysis: split ratios and changes in individual holdings
Table 4. Univariate analysis: post-split ranges and changes in individual holdings
Table 5. Linear regression model (with robust standard errors)—effect of split ratios on individual ownership
Table 6. Linear regression model (robust standard errors)—effect of PSPR on individual ownership and institutional ownership
Table 7. Linear regression (with robust standard errors) estimates for sub-sample (bullish and bearish period)