
Figures & data
Figure 1. Performance of bitcoin versus selected asset classes. A bitcoin vs stock market indices. B Bitcoin vs Bonds Market Indices. C Bitcoin vs Currencies. D Bitcoin vs Real Estate.
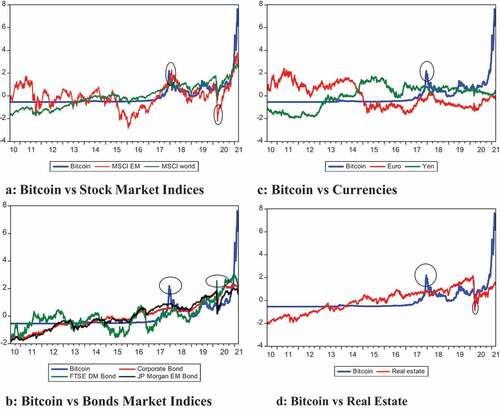
Table 1. Summary Statistics for daily data for the complete period
Table 2. Summary Statistics for weekly data for the complete period
Table 3. Summary Statistics for daily data for the Covid-19 period
Table 4. DCC coefficient of bitcoin versus other asset classes
Figure 2. Dynamic correlations between bitcoin and the selected assets during the complete period (17 July 2010 to 10 March 2021).
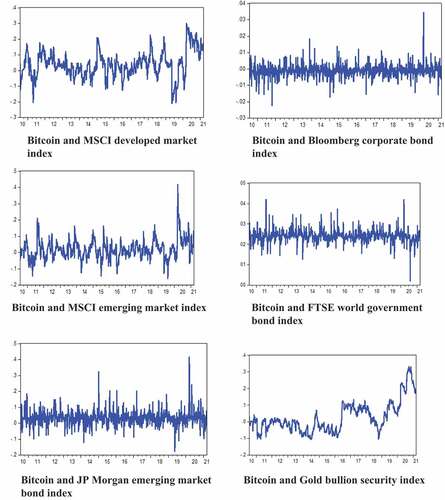
Figure 2. (continued).
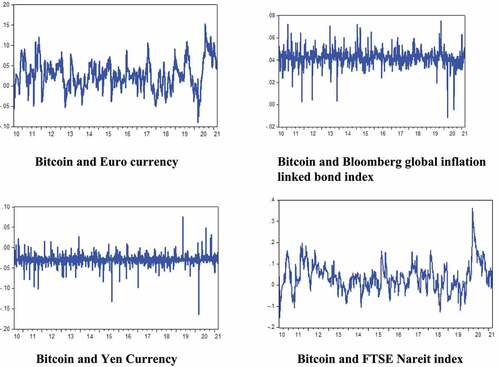
Figure 3. Dynamic correlations between bitcoin and other assets during Covid-19 period (1 January 2020 to 10 March 2021).
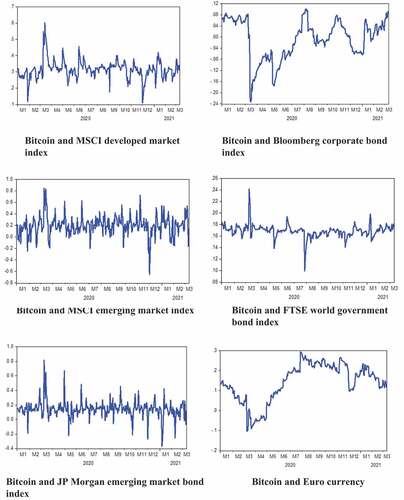
Figure 3. (continued).
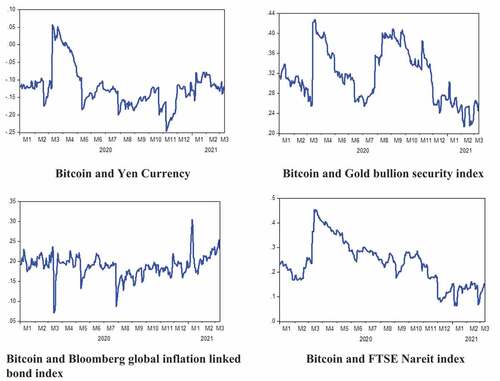
Table 5. DCC-GARCH: Bitcoin as a hedge and safe haven against global traditional and alternative asset classes using daily data
Table 6. DCC-GARCH: Bitcoin as a hedge and safe haven against global traditional and alternative asset classes using weekly data
Table 7. DCC-GARCH: Bitcoin as a hedge and safe haven against global traditional and alternative asset classes using daily data during Covid-19 period
Table 8. DCC-GARCH: Bitcoin vs gold and ILB