Figures & data
Figure 1. Revenue from environmental taxes in the OECD 1994–2019, as a percentage of GDP and as a percentage of total tax revenue.
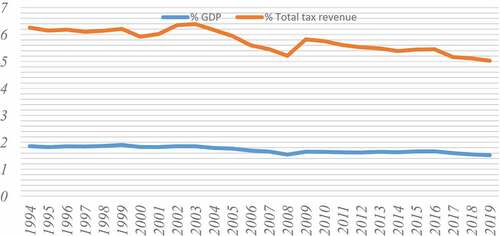
Figure 2. Composition of environmentally related tax revenue in OECD countries in 2019.
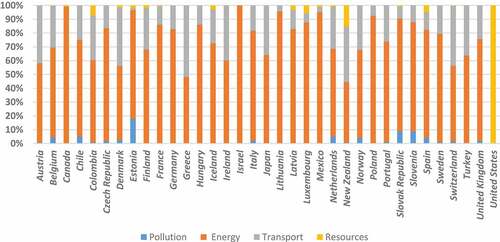
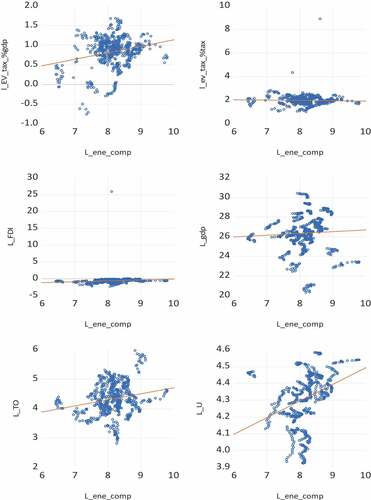
Figure 3. Energy consumption.
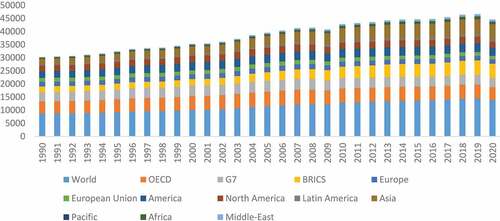
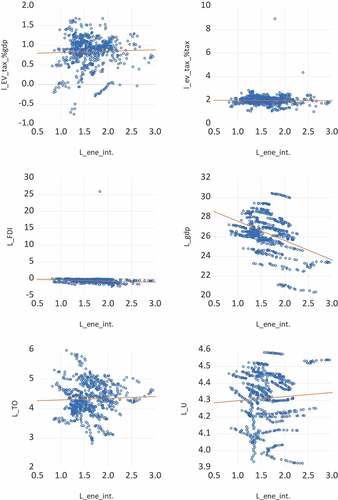
Figure 4. Energy intensity of GDP at constant purchasing power parities (koe/$15p) (from 2000–2020).
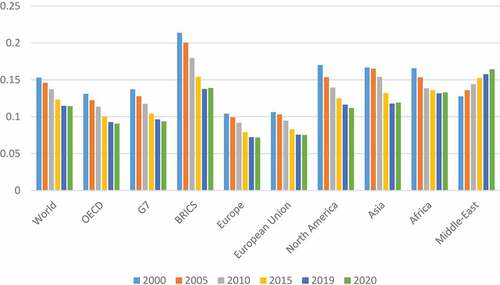
Table 1. An a prior expectation between energy consumption and determinants of environmental taxes. Dependent variable: energy consumption and energy intensity
Table 2. Definition and sources of variables
Table 3. Cross-sectional dependence test
Table 4. Results of unit root test
Table 5. Panel co-integration results
Table 6. Results of estimation
Table 7. Disaggregation of environmental tax effect (long-run coefficients)
Table 8. Estimation results (using Share of environmental tax to GDP as independent variable)
Table A1. Descriptive statistics
Table B1. Quantile regression estimates (dependent variable: energy consumption)
Table C1. Quantile regression estimates (dependent variable: energy intensity)
Table C2. Panel generalized methods of moments Dependent variable: Energy Intensity
Table C3. Panel generalized methods of moments. dependent variable: energy consumption