
Figures & data
Figure 1. Trend of FDI inflow in high income nations (yearly).
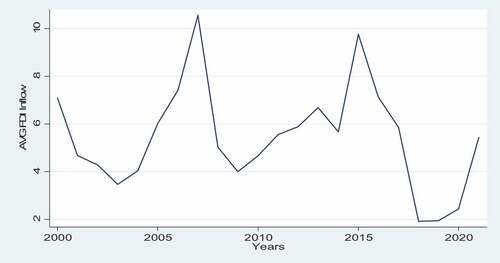
Figure 2. Trend of uncertainty in high income nations (yearly).
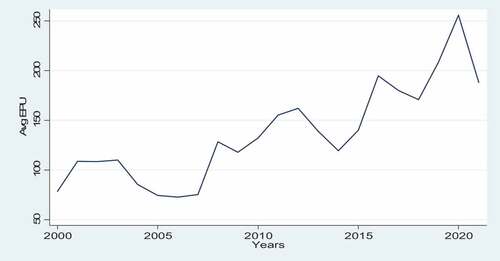
Table 1. Variable measurement
Table 2. Descriptive statistics
Table 3. Correlation matrix
Table 4. Testing Cross-sectional dependence
Table 5. Panel unit root
Table 6. Countrywide optimal lag (111,011)
Table 7. Panel co-integration
Table 8. Panel ARDL (DFE)