
Figures & data
Figure 1. Proportion of SMEs with access to finance, by state-religion.
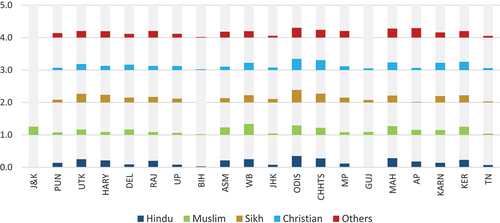
Table 1. Variable definition and summary statistics
Table 2. Correlation matrix of key variables
Table 3. Baseline regressions ;For the TABLE, the numbers within brackets should come below the coefficient
Figure 2. Average marginal effects.
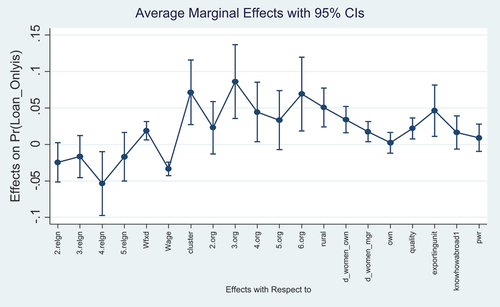
Table 4. Robustness checks—Impact of gender
Table 5. Robustness checks—Impact of organization & caste The Figure within brackets in Table should come BELOW the coefficient)
Table 6. Robustness check—Access to and use of loans
Table 7. Robustness checks—Relevance of state characteristics The figure in bracket in Table should come BELOW the coefficient