
Figures & data
Table 1. Distribution of firm-years that filed their accounts and have been assigned a failure score
Table 2. Distribution of failed and non-failed cases required to have a CA per CA compliance and SA appointment
Table 3. Comparison of alternative bankruptcy prediction models
Figure 1. Estimated contribution of explanatory variables to the global accuracy of the failure score.
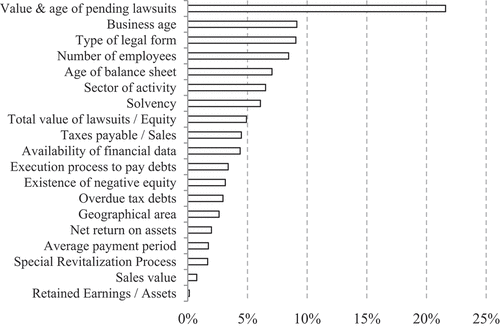
Table 4. Distribution of the different certification of accounts with alternative disclosures (CA-Type), by auditor size and by failed and non-failed cases
Table 5. Descriptive statistics. The statistics are from the full sample of 150,105 firm-years
Table 6. Variance inflation factors
Table 7. Pairwise correlations
Table 8. Estimates for Eq. (2)
Table 9. Estimates for EquationEquation 2(2)
(2)