
Figures & data
Table 1. Background information
Table 2. Knowledge on the electronic transaction levy
Table 3. Perception of Ghanaians on the 1.50% levy on the electronic transactions
Table 4. Intention to use electronic transactions affected by the levy
Figure 1. Graphical output of the impact of E-levy based on perception.
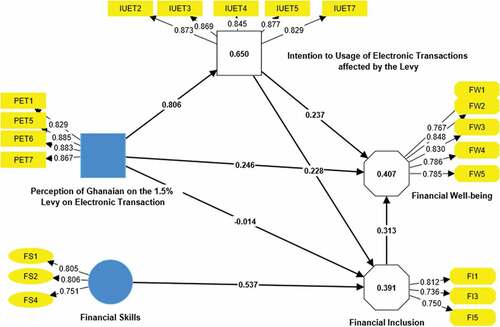
Table 5. Diagnostics
Table 6. Path coefficient
Table 7. Mediating and total effect
Table 8. Summary of PLS-SEM findings
Table A1. Cross loading
Collinearity statistics