Figures & data
Figure 1. Times series observations trends.
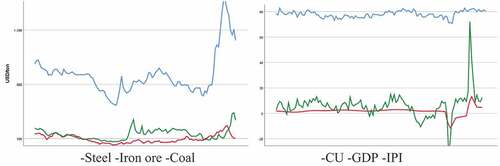
Table 1. Unit root test
Table 2. Data Set
Table 3. ARIMA-TF (1, 1, 0) forecast of in sample (out of sample) data
Table 4. ANN forecast of in sample (out of sample) data
Table 5. WLS regressions of in sample data:
Table 6. Residual measures of in sample forecasts
Table 7. Residual measures of out of sample forecasts
Table 8. Wilcoxon signed-rank test for out of sample forecasts
Table 9. Diebold–Mariano (DM) and Harvey–Leybourne–Newbold (HLN) results for out of sample forecasts
Table 10. Hypotheses of testing summary
Table 11. WLS regression results for in sample data of sub segments
Table 12. Residual measures of in sample data for sub segments
Table 13. Residual measures of out of sample data for sub-segments
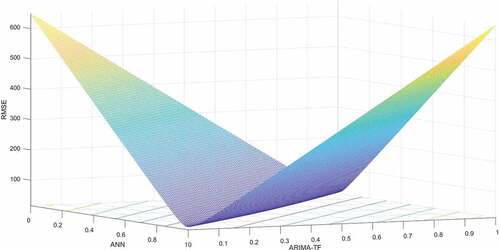
Figure 2. Vertex line indicating lowest RMSE with forecast weights constrained to be nonnegative and sum to one.