
Figures & data
Table 1. Variables description and expected signs
Figure 1. Correlation plot for developing and developed countries.
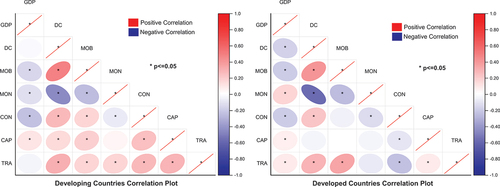
Figure 2. Descriptive statistics summary of developing countries (GDP, DC, MOB, MON, CON, CAP and TRA) through box plot.
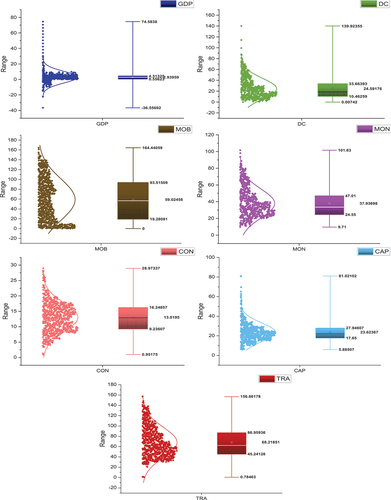
Figure 3. Descriptive statistics summary of developed countries (GDP, DC, MOB, MON, CON, CAP and TRA) through box plot.
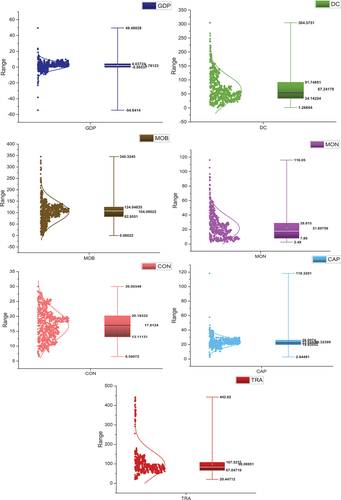
Table 2. Hausman test for model selection
Table 3. Results random effect model
Table 4. Results of fixed effect model