
Figures & data
Figure 1. Number of presidential elections by countries, international foundation for electoral systems data, 1985–2015.
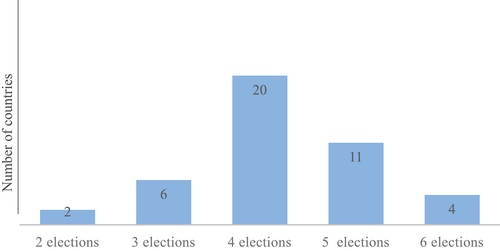
Figure 2. Government expenditure in pre-election and election years, world development indicators data, 1985–2015.
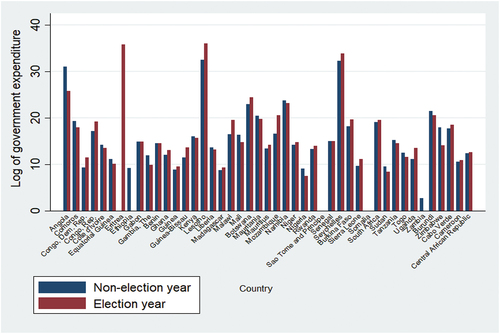
Figure 3. Government expenditure and GDP per capita, world development indicators data data, 1985–2015.
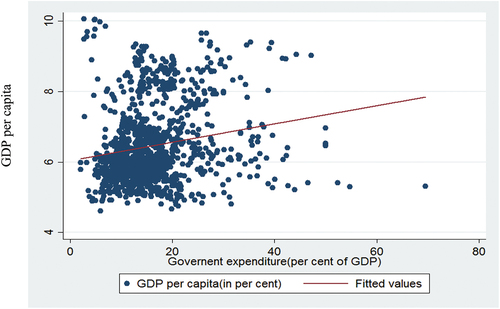
Figure 4. The distribution of debt servicing on election by country, international financial statistics data, 1985–2015.
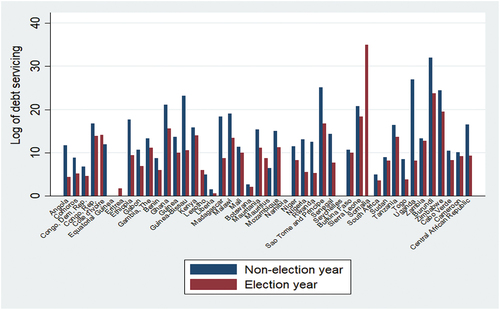
Table 1. Description of variables and data sources
Table 2. Distribution of means of some selected variables across years of election
Table 3. Bivariate estimates for effect of election variables on debt servicing (dependent variable: debt servicing)
Table 4. Effect of electoral on government debt servicing (dependent variable: debt servicing)
Table A1. Unit root test results for the variables at levels
Unit root test results for the variables at first difference
Variables included in the debt servicing model
Post-estimation test for the GMM estimations
List of countries in the study