
Figures & data
Figure 1. Exhibits weekly price index trends for the entire sample.
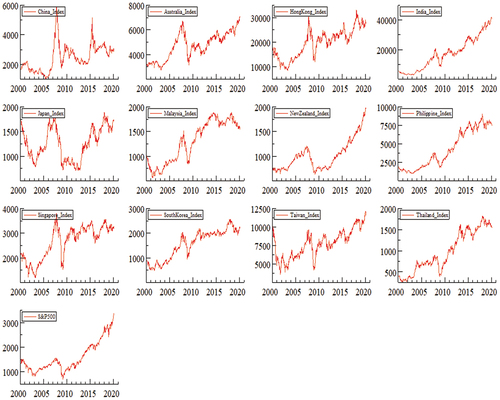
Figure 2. Exhibits weekly price movements for the entire sample.
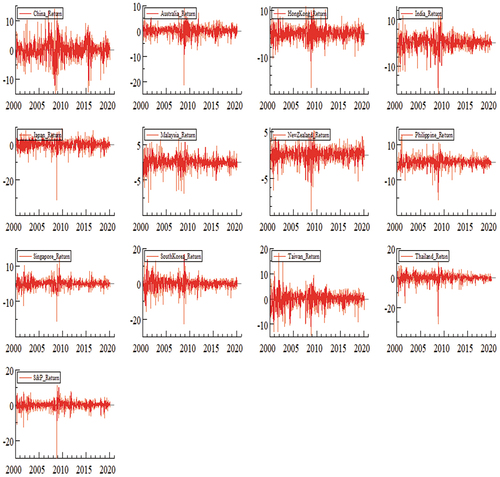
Table 1. Descriptive statistics of all stock markets using weekly return data
Table 2. Presents the calculated result of the ARMA (1, 1)-DECO-GARCH (1, 1) model
Figure 3. Dynamic equicorrelation across all stock markets.
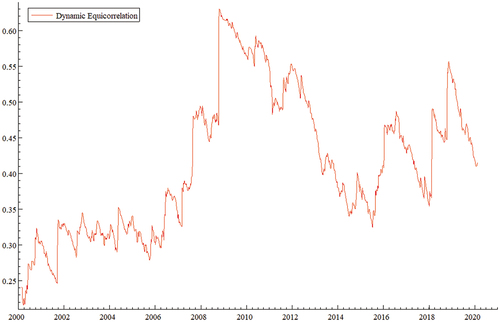
Table 3. Diagnostic tests
Figure 4. Conditional variances for each stock market using ARMA(1,1)- DECO-GARCH(1,1) model.
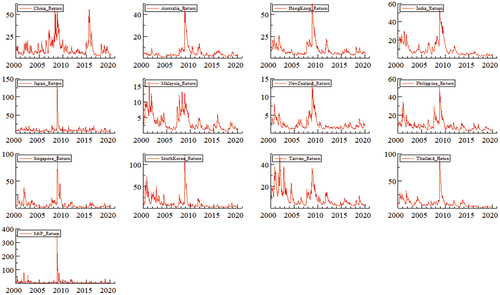
Table 4. Dynamic Connectedness Return spillovers across all sample stock markets
Table 5. Dynamic Connectedness conditional variance volatility spillovers across all sample stock markets
Figure 5. Dynamic total connectedness return and conditional variance volatility for all stock markets.
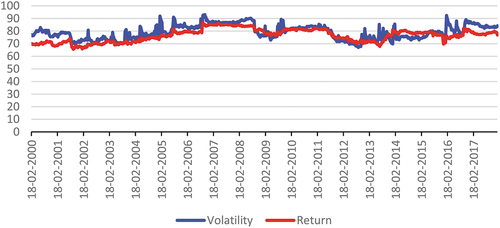
Figure 6a. A Net return Spillovers.
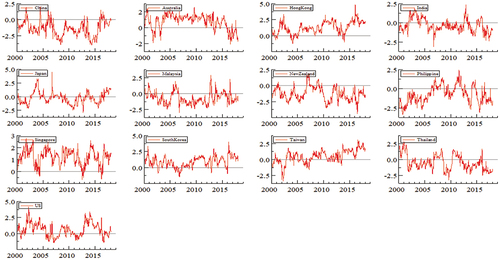
Figure 6b. Net volatility spillovers.
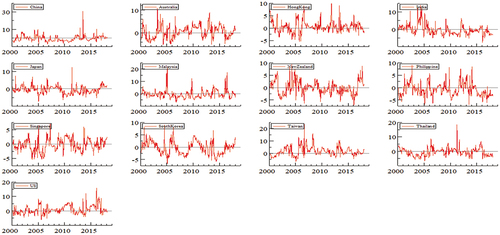
Table 6. Performance of optimal portfolios’ hedge ratios
Table 7. Performance optimal portfolios’ weights