
Figures & data
Figure 1. Inflation (%) and Interest Rate (%) in Indonesia, 2006Q1-2010Q4.
Source: Bank Indonesia (processed)
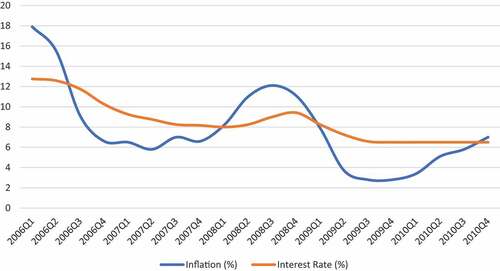
Figure 2. Inflation (%) and Interest Rate (%) in Indonesia, 2011M1-2018M12.
Source: Bank Indonesia (processed)
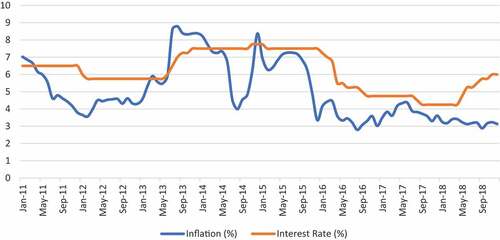
Figure 3. Money Supply (Billions of Rp) in Indonesia, 2006M1-2018M12.
Source: Bank Indonesia (processed)
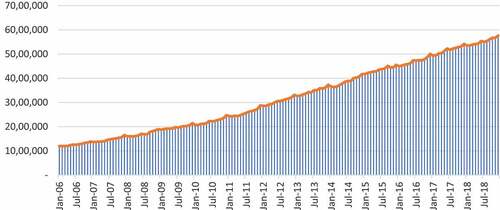
Figure 4. Exchange Rate (IDR/USD) in Indonesia, 2006Q1-2018Q4.
Source: Bank Indonesia (processed)
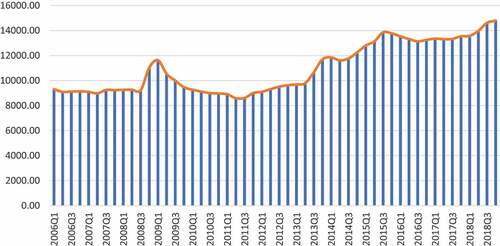
Figure 5. Bank Indonesia Financial System Stability Index.
Notes: The green area is normal condition while the red one is suspected crisis.
Source: Bank Indonesia (processed)
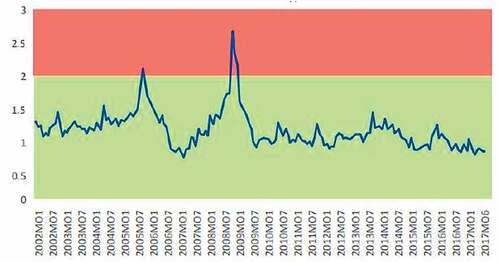
Table 1. Descriptive statistics
Table 2. Estimation result of the stationary stochastic process at level
Table 3. Estimation result of the difference stationary process at first difference
Table 4. Estimation result of the long-run model: dependent variable is LAFSI
Table 5. Estimation result of the error correction model: dependent variable is ∆LAFSI
