
Figures & data
Figure 1. Trends in fiscal capacity and public health expenditure.
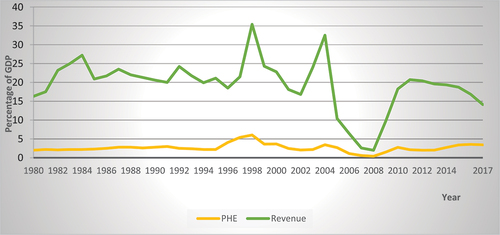
Table 1. Summary statistics
Table 2. Results of ADF and PP unit root tests
Table 3. Results of ZA structural break unit root tests
Table 4. Results of Gregory-Hansen cointegration testing with structural breaks
Table 5. ARDL bounds cointegration testing results
Table 6. Long-run ARDL (2, 1, 2, 0, 1, 0) model results
Table 7. Short-run ARDL (2, 1, 2, 0, 1, 0) cointegrating Error Correction Model results
Table 8. Summary of diagnostic tests
Figure 2. Cumulative sum of recursive residuals (CUSUM).
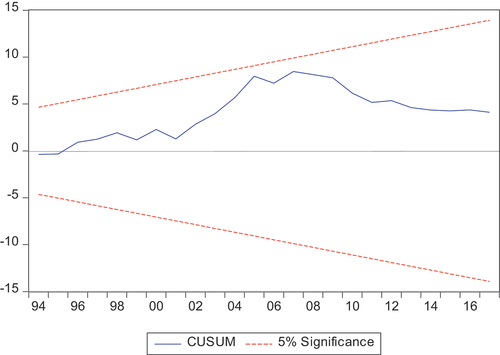
Figure 3. Cumulative sum of squared recursive residuals (CUSUMsq).
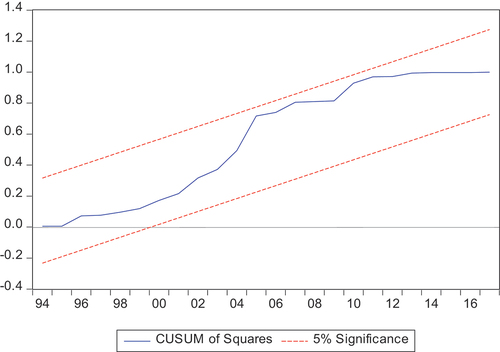
Table 9. Regression results of FMOLS and CCR
Table 10. Regression results with GGCE as the proxy for fiscal capacity