Figures & data
Figure 1. Money market and lending rate from 1990:3 to 2017:2. Note: The blue dot-dashed line represents the start of AFC in 1997:7. The impact of AFC that mainly occurs on 1997:7 when the Indonesian currency starts to plunge.
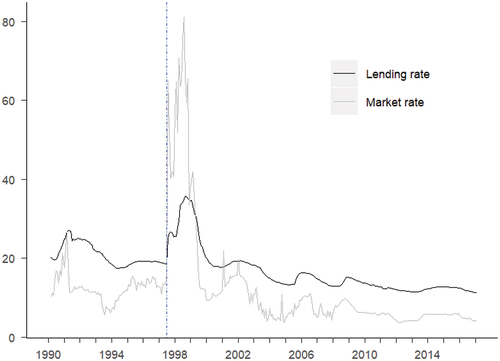
Table 1. Related studies
Table 2. Unit root and structural break test
Table 3. Results from sub-period estimations
Figure 2. The stability of asymmetric in cointegration and long-run pass-through. Note: The x-axis shows the last observation used in the window. For (a) bound test results, the solid line represents the estimated F-statistics that standardized to its relevant upper bound 10 percent critical value, which presented in dotted line. For (b) asymmetric long-run pass-through results, the solid line represents the p-value from Wald test, and the dotted line represents the 10 percent critical value.
Figure 3. The dynamics of asymmetric long-run pass-through across period. Note: The x-axis shows the last observation used in the window. The solid line represents the difference between upward and downward pass-through, with darker shade represents its standard errors. The light shades represent a window in which the asymmetric long-run pass-through is statistically significant. The blue dot-dashed lines represent the events related to last observation in the window, that is the introduction of ITF, the announcement to change the policy rate, and the effective change in the policy rate respectively. The red dot-dashed lines represent the events related to first observation in the window, that is the start of AFC crisis, and the introduction of ITF respectively.
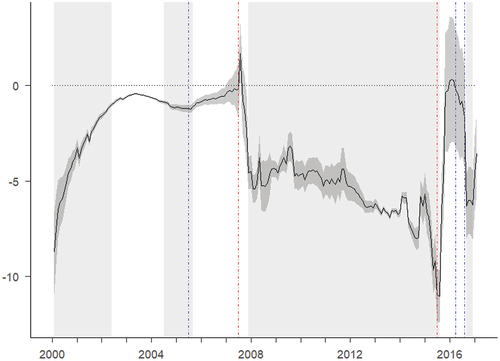
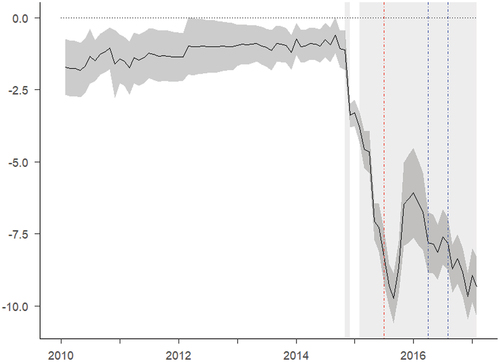
Figure 4. The dynamics of asymmetric long-run pass-through across period using different proxy for money market. Note: The x-axis shows the last observation used in the window. The solid line represents the difference between upward and downward pass-through, with darker shade represents its standard errors. The light shades represent a window in which the asymmetric long-run pass-through is statistically significant. The blue dot-dashed lines represent the events related to last observation in the window, that is the announcement to change the policy rate, and the effective change in the policy rate respectively. The red dot-dashed line represents the event related to first observation in the window, that the introduction of ITF.