Figures & data
Table 1. Summary statistics on variables used in study (n = 383)
Table 2. Descriptive statistics on price, quantity sold and marketing costs by marketing channel
Table 3. Maximum likelihood estimates from first hurdle and the average partial effects (n = 383)
Table 4. ML estimates from second hurdle and average partial effects (n = 383)
Table 5. Marginal effects by land area disaggregated into quartiles
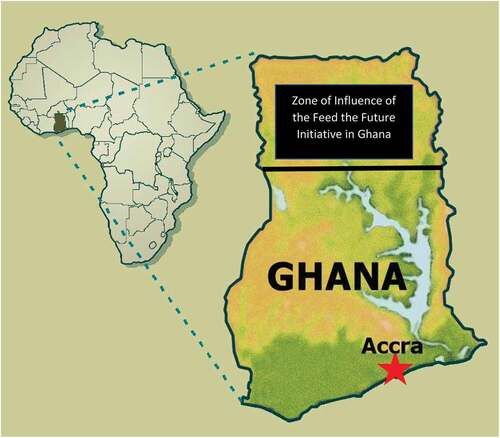
Figure A1. A Close-up Picture of Map of Ghana within Africa Showing the General Study Area.