Figures & data
Table 1. Total connectedness index of stocks and cocoa
Table 2. Total connectedness index of stocks and coffee
Table 3. Total connectedness index of stocks and copper
Table 4. Total connectedness index of stocks and corn
Table 5. Total connectedness index of stocks and crude oil
Table 6. Total connectedness index of stocks and gold
Table 7. Total connectedness index of stocks and natural gas
Table 8. Total connectedness index of stocks and palladium
Table 9. Total connectedness index of stocks and palm oil
Table 10. Total connectedness index of stocks and rice
Table 11. Total connectedness index of stocks and silver
Table 12. Total connectedness index of stocks and soybeans
Figure 1. Network plots of commodity and African stock markets’ returns.
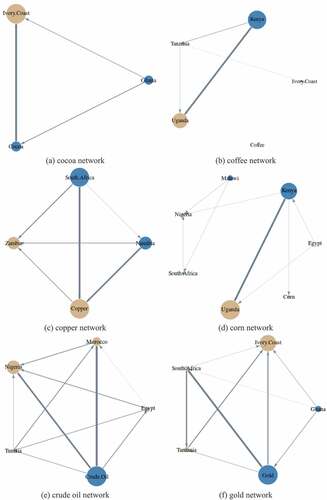
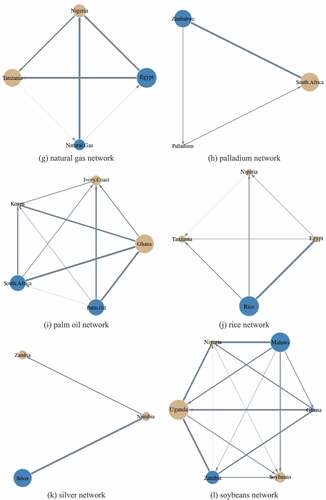
Figure 2. Time-varying connectedness between global commodity and African stock returns.
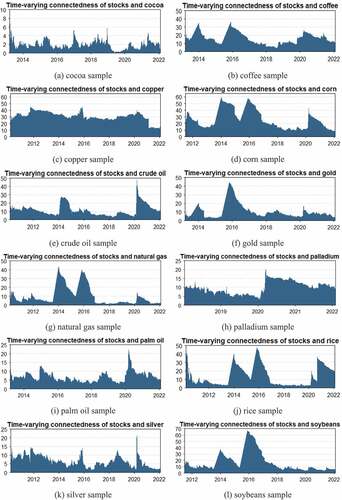
Figure 3. Directional spillovers between commodities and African stocks.
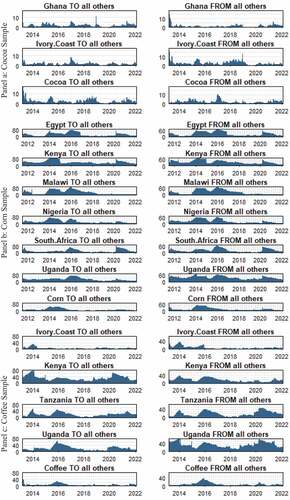
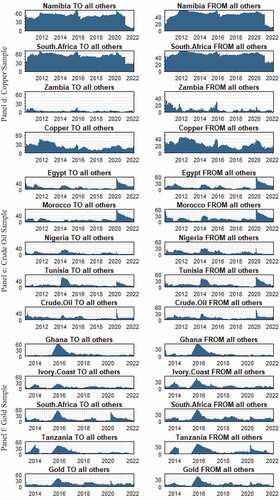
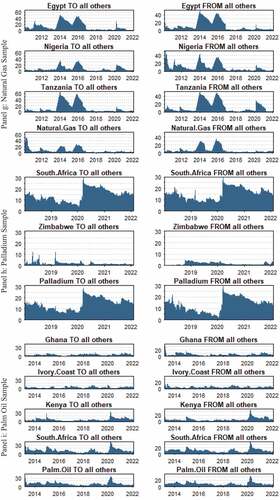
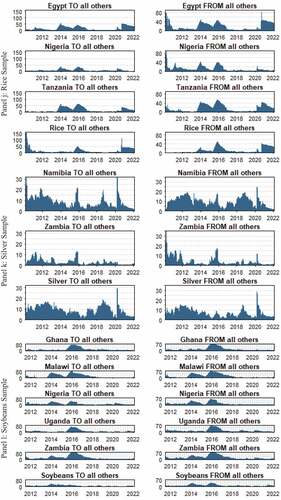
Figure 4. Net Directional Spillovers between commodities and African stocks.
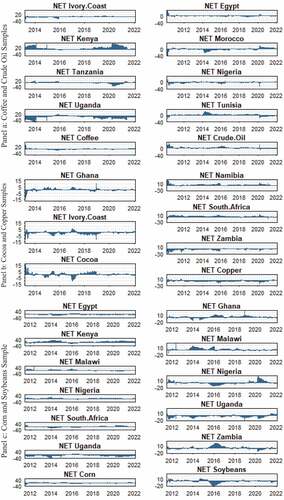
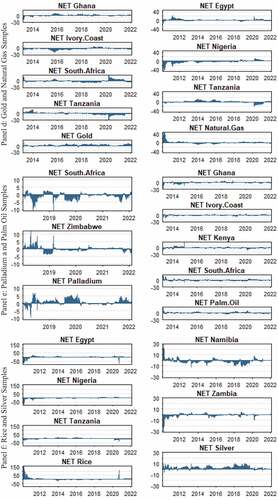
Table 13. Summary of significant portfolio benefits based on commodity sectors
Table A1. Descriptive statistics
Figure A1. Trajectories of indices and returns of African stocks and global commodities.