
Figures & data
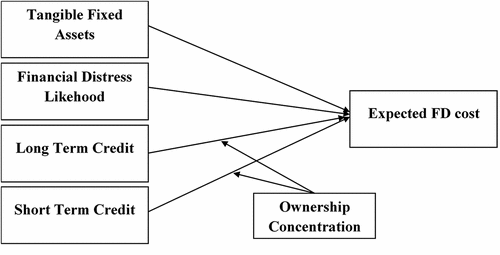
Figure 1. Theoretical framework of the study.
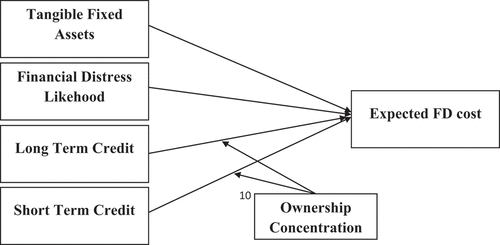
Table 1. Sample Distribution
Table 2. Description of variables
Table 3. Classification of the sample by healthy and distressed firms (based on Interest coverage ratio)
Table 4. Descriptive Statistics
Table 5. Matrix of correlations
Table 6. Variance inflation factor
Table 7. Regression results
Table 8. Regression results (Moderating effect)
Table 9. Regression results (Robustness test)