
Figures & data
Table 1. Variables measurement
Table 2. Descriptive statistics and Pearson correlation
Figure 1. Average of Portfolio at risk in Palestine from 2010 to 2020.
Source: based on historical data obtained from Palestinian MFIs annual reports.
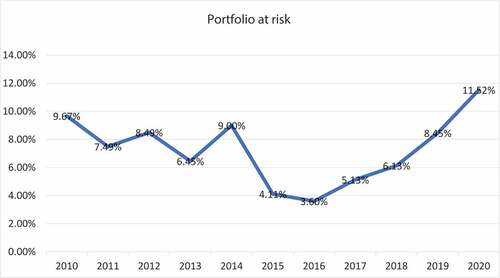
Table 3. Results of panel unit roots test (Levin Lin Chu test)
Table 4. Optimal panel data estimates
Table 5. Residual diagnostic tests of panel data estimates
Table 6. Panel data regression results