
Figures & data
Figure 1. Geographical map of Ethiopia and its neighboring countries.
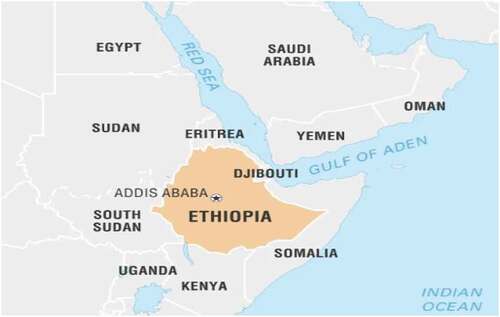
Table 1. Specific sources of data
Table 2. Summary of variables’ description
Figure 2. Trends in the share of government expenditure on education and health to GDP in Ethiopia.
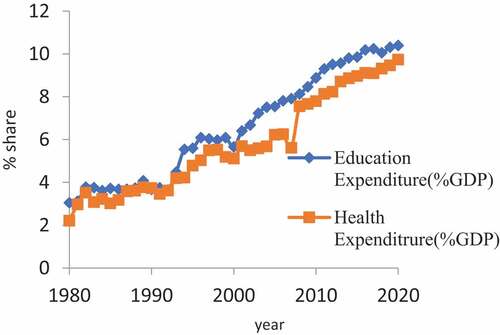
Figure 3. Trends of Real GDP in Ethiopia (1980–2020).
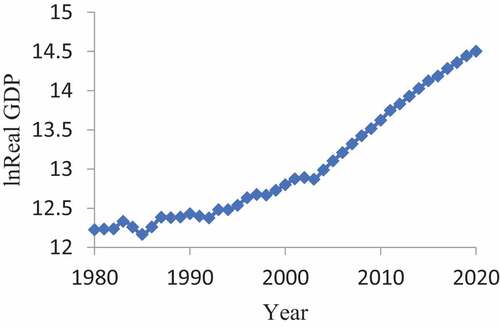
Figure 4. Trends of Labor force growth rate in Ethiopia.
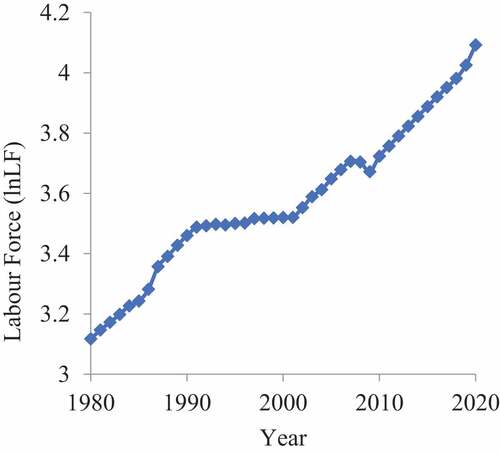
Figure 5. Trends of secondary school enrolment rate in Ethiopia (1980–2020).
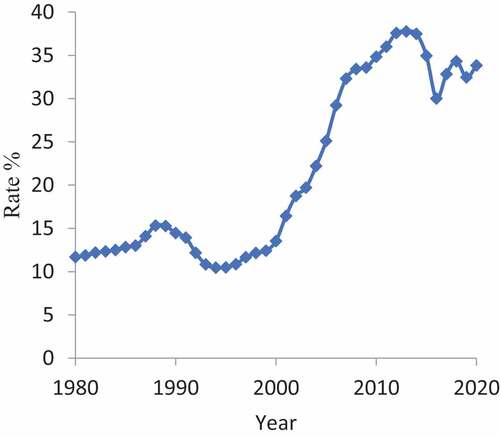
Figure 6. Inflation annual percentage change trend, Ethiopia (1980–2020).
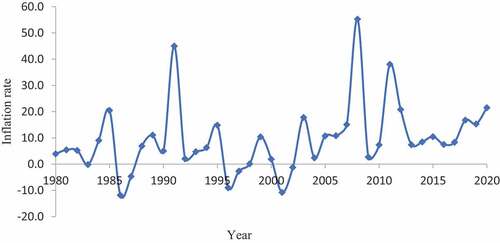
Table 3. Lag order selection
Table 4. Augmented Dickey-Fuller and Phillips-Perron Unit Root Tests
Table 5. ARDL Bound test for Long-run relationship
Table 6. The long-run ARDL parameter estimates
Table 7. Summary of diagnostics tests
Figure 7. CUSUM of Squares.
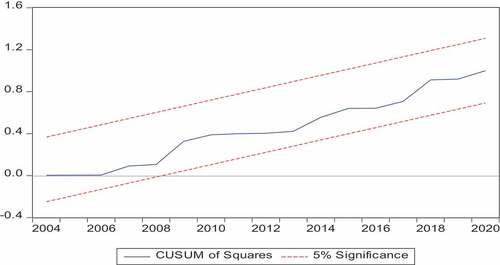
Table 8. ECM Regression