
Figures & data
Figure 1. Public Investment and Private Investment in South Africa (1980–2018).
Source: Own compilation from World Bank Development Indicators (2021)
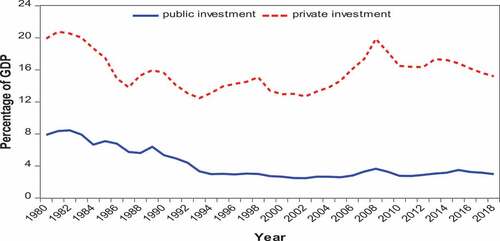
Table 1. Stationarity Test for all Variables
Table 2. BDS Test for Nonlinearity
Table 3. Bounds F-test for Cointegration Results
Table 4. Results of Long-Run and Short-Run Estimation
Table 5. Long- and Short-Run Asymmetry Results
Table 6. Diagnostic Tests Results
Figure 2. Plot of Dynamic Multiplier Graph.
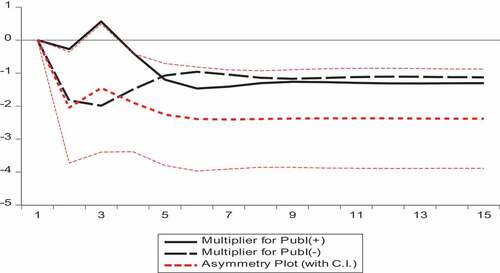
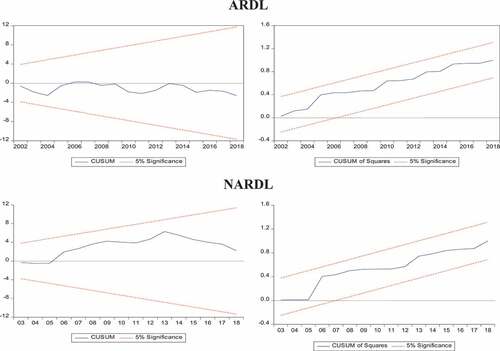
Figure 3. Plot of CUSUM and CUSUMQ.
Data availability statement
The data that support the findings of this study are available upon reasonable request.